
Bitcoin hovers above $81K in an overnight recovery, and whale activity hints at another potential price surge.
As Bitcoin maintains its dominance above the $81,000 mark, it has seen a notable comeback. After a 5.48% surge yesterday, an intraday pullback of 1.62% has dropped the market price to $81,524.
With Bitcoin fluctuating near the 61.80% Fibonacci level, the chances of a post-retest reversal are high. Could this drop Bitcoin back to the $75,000 mark?
Is Bitcoin in for Another Post-Retest Reversal?
On the daily chart, the BTC price trend shows a bullish engulfing candle, reclaiming the 61.80% Fibonacci level. This critical horizontal level is at $81,855.
Despite a 24-hour high of $83,733, the intraday pullback signals a possible post-retest reversal for Bitcoin. This is due to the recently broken support-to-resistance trendline of a symmetrical triangle pattern.
With a higher price rejection, the bearish intraday candle suggests a continuation of the bearish trend. Currently, the daily RSI line is fluctuating near the oversold boundary level, reflecting a weakening bullish momentum. Due to the lack of buying pressure, the possibility of a significant correction in Bitcoin remains high.
Whales Acquire 65K BTC Amid Volatile Market Conditions
Notably, the recent swing low in Bitcoin has triggered a new wave of whale accumulation. As per CryptoQuant, the whales purchased over 65,000 BTC in the recent crash.
Furthermore, in a separate tweet, the on-chain data provider highlighted that Bitcoin corrections during a bull market are normal. According to the platform, Bitcoin’s 22% drawdown is not unusual for a bull market.
However, the valuation matrix signals a deeper correction than usual. During the 2016-17 bull market, similar drops didn’t trigger such a bearish sentiment. Therefore, the platform warns of a potential steeper correction for Bitcoin.
Bitcoin’s 22% drawdown isn’t unusual for a bull market.
What’s different? Valuation metrics signal a deeper correction than usual.
In 2016-17, similar drops didn’t trigger this level of bearish signals—this time might be different. pic.twitter.com/6xSRniQaje
— CryptoQuant.com (@cryptoquant_com) March 11, 2025
US Bitcoin ETFs Record $1.54 Billion in Outflow Since March 3
Despite Bitcoin’s surge on March 11, U.S. Bitcoin Spot ETFs recorded a net outflow of $371 million. With another day of outflows, Bitcoin ETFs have registered their 7th consecutive day of outflows in the U.S. market.
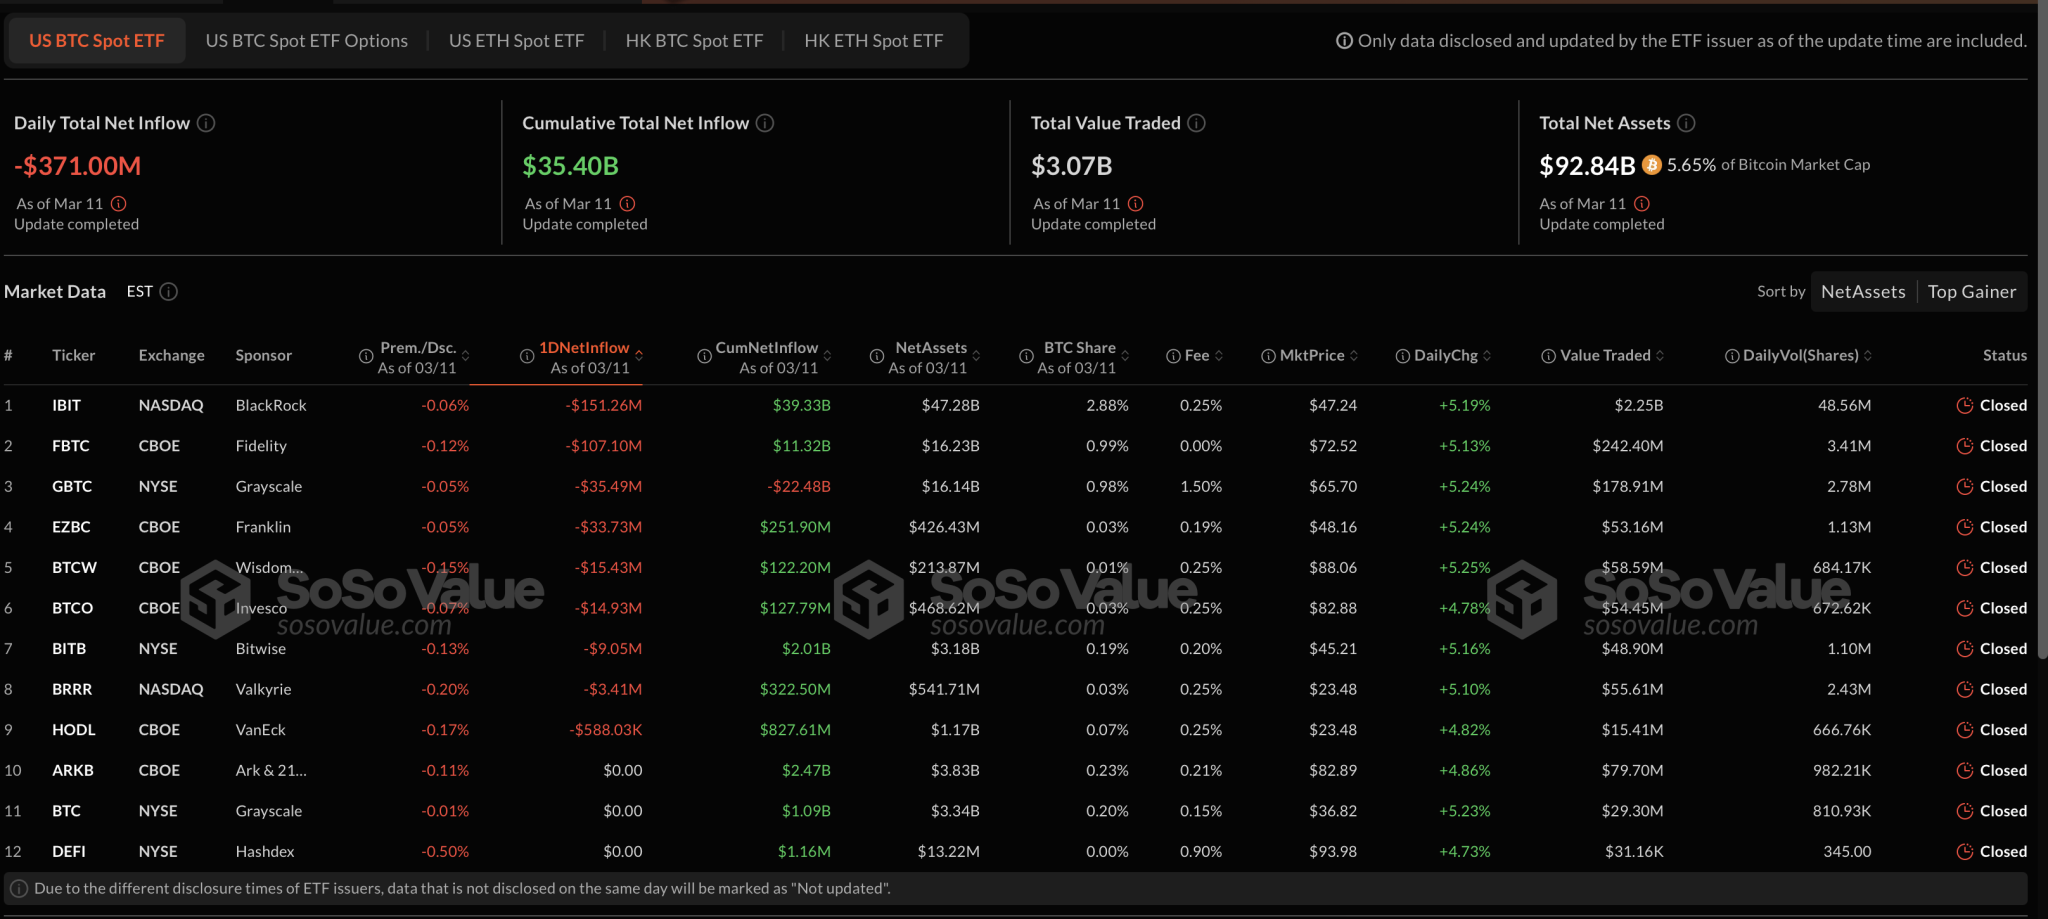
Driving the outflows, BlackRock and Fidelity offloaded $151 million and $107 million, respectively, while three ETFs saw zero outflows. Over the last seven trading days, Bitcoin ETFs have experienced a total outflow of $1.54 billion.
Analyst Highlights Key On-Chain Price Levels
Analyst Ali Martinez suggests that the short-term ongoing pullback in Bitcoin could encounter strong support levels at $79,270 and $69,450, based on on-chain data from IntoTheBlock.
The key support near $79,000 holds a total volume of 301.41K BTC in 368.55K addresses. Meanwhile, the short-term recovery leading to a bullish engulfing candle could face immediate resistance at $84,296, extending to $86,753, which holds a supply of 287.2K BTC in 556K addresses.
On-chain data from @intotheblock highlights two key support levels for #Bitcoin $BTC: $79,270 and $69,450. pic.twitter.com/gYlqMgbJce
— Ali (@ali_charts) March 12, 2025