
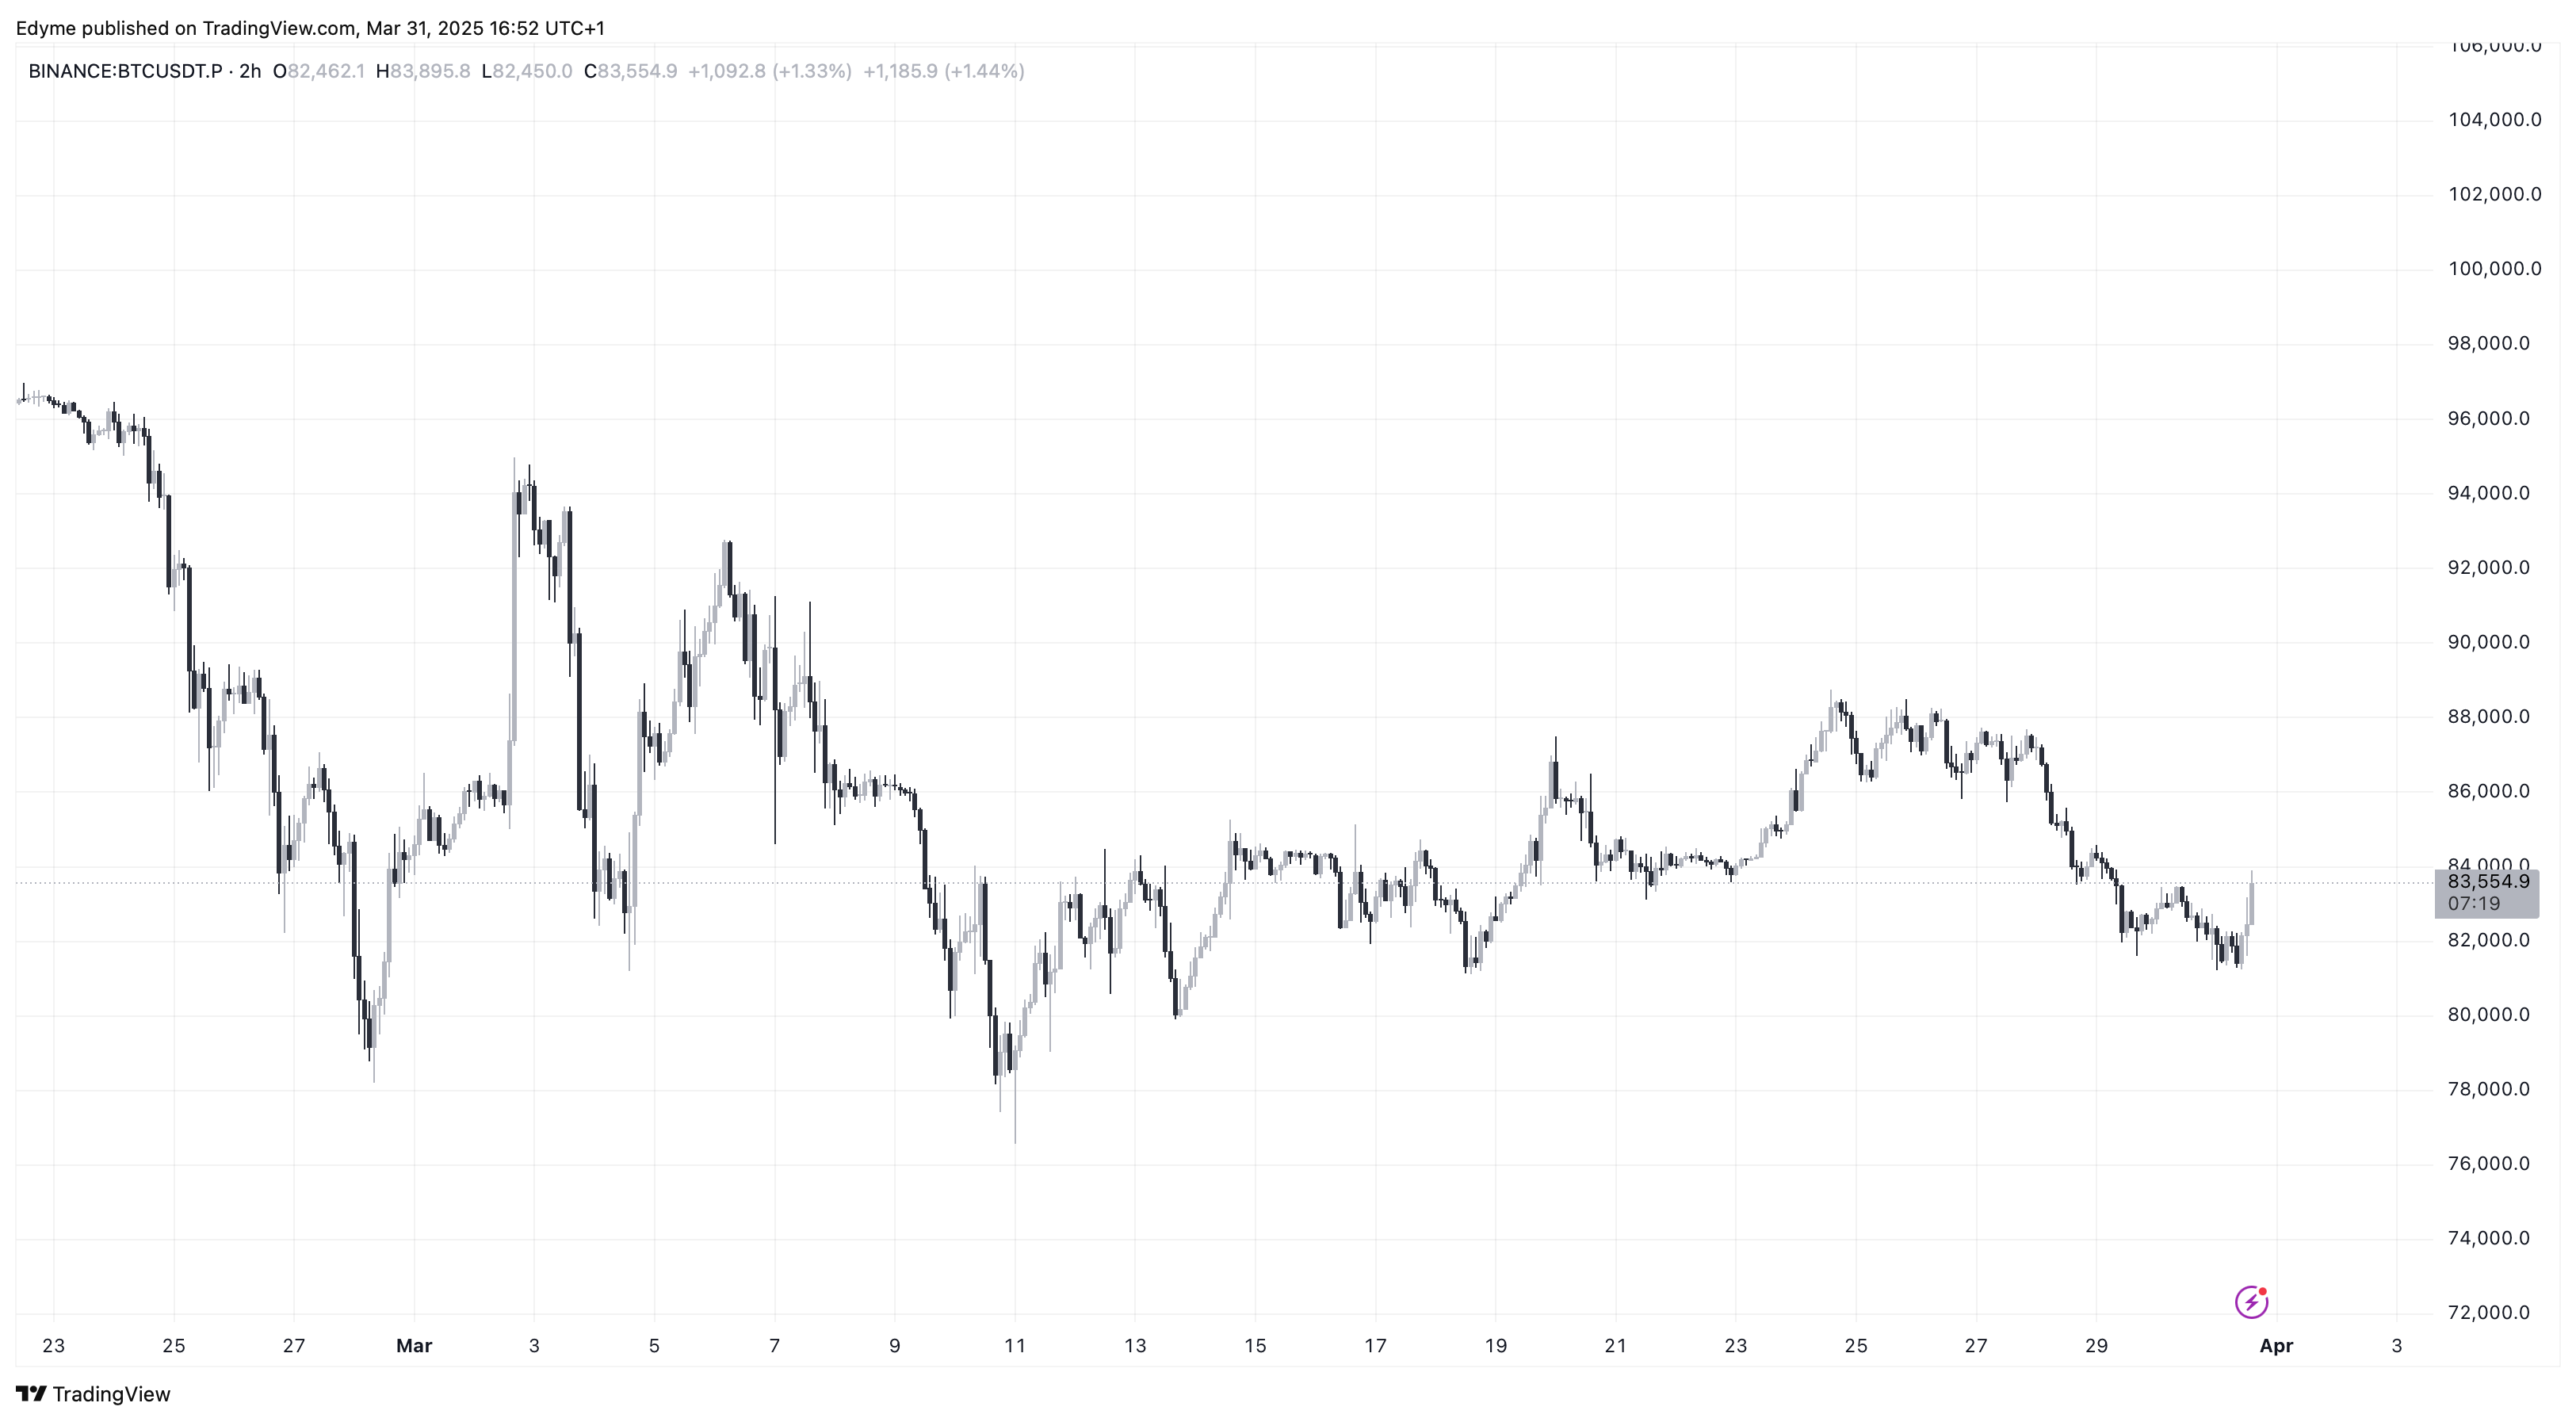
Bitcoin has continued to show weakness in price movement, with limited upside momentum over the past several weeks. The cryptocurrency has declined by 22.3% in the last month alone, bringing its price down to $83,191 at the time of writing.
The drop reflects ongoing uncertainty in the broader crypto market, as investors are struggling with reduced risk appetite and a lack of strong bullish catalysts.
Whale Accumulation Patterns Echo Previous Bull Market Phases
Despite the downtrend, recent on-chain activity suggests that certain investor cohorts remain confident in Bitcoin’s long-term value. In particular, whale addresses—wallets holding between 1,000 and 10,000 BTC—have demonstrated a historical correlation with Bitcoin’s price trends.
According to CryptoQuant contributor Mignolet, the current market cycle bears a resemblance to the 2020 bull cycle, where these whales exhibited accumulation behavior during bearish sentiment phases.
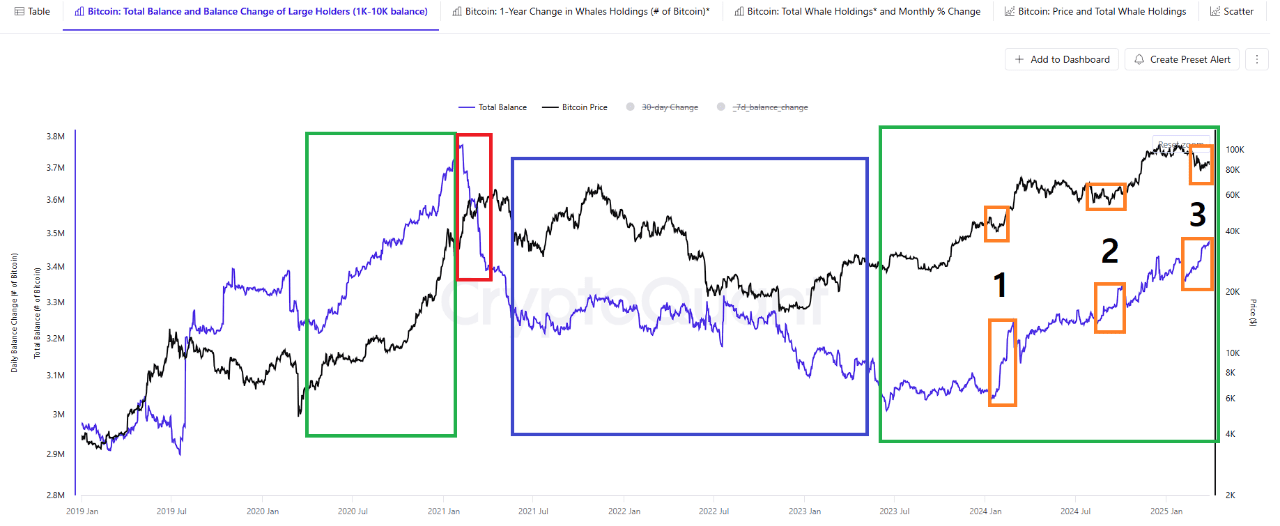
Mignolet noted that these patterns occurred three times throughout the 2020 cycle, each coinciding with brief drawdowns in price. In the current phase, similar accumulation activity is being observed among whale entities, particularly those with holdings in the 1,000 to 10,000 BTC range.
These patterns, as Mignolet suggests, may indicate that these market leaders are not exiting their positions, despite price pressure. Notably, the significance of whale behavior lies in its historical influence on market direction.
As long as whales remain in accumulation mode, it could provide a base of support for the broader market and reduce the likelihood of further rapid declines. However, this dynamic does not eliminate the possibility of continued volatility, especially if broader market sentiment does not improve.
Bitcoin Short-Term Holders Show Signs of Capitulation
In contrast to whale activity, short-term holders (STHs) are showing signs of distress. Another CryptoQuant analyst, Darkfost, highlighted that the Short-Term Holder Spent Output Profit Ratio (SOPR) has remained below 1.0 for over two months, currently hovering around 0.98.
This metric compares the selling price of Bitcoin with its acquisition price. When it falls below 1, it suggests that holders are selling at a loss—often viewed as a sign of capitulation.
STH Capitulation
“When this ratio drops below 1, it signals capitulation among STHs, often leading to short-term price declines.
We can confirm this trend by observing the $BTC being sent to exchanges at a loss.” – By @Darkfost_Coc
Link ⤵️https://t.co/BUIo9caGck pic.twitter.com/QfNfFpT9VL
— CryptoQuant.com (@cryptoquant_com) March 31, 2025
Additionally, on-chain data shows that approximately 46,000 BTC have been sent to exchanges at a loss in recent weeks, highlighting the stress among STHs.
Historically, periods of heavy short-term capitulation have often preceded market bottoms, as weak hands exit positions and longer-term investors take advantage of the discounts.
Featured image created with DALL-E, Chart from TradingView