
Bitcoin is back under $96,000 as the crypto market starts the week on a bearish note. Is a downfall to $90k imminent this week?
Last week, Bitcoin faced massive fluctuations, with a 7-day low at $93,340 and a high at $99,508. Despite the massive fluctuation, BTC concluded the week at $96,262, with a surge of 0.14%.
Meanwhile, the uncertainty in the BTC price trend takes a bearish shift at the start of this week. With an intraday fall of 0.57%, Bitcoin trades at a market price of $95,714.
Furthermore, last week’s cumulative weekly flow in the Bitcoin ETF remained negative. Amid such conditions, will Bitcoin sustain above its crucial support near the $94,000 mark, or is a downfall imminent?
Bearish Pressure Intensifies on Daily Chart
In the daily chart, the BTC price trend reveals a significant bearish influence that dominates the price trend. Currently, Bitcoin is above the $95,000 mark after rejection from the overhead trend line.
Along with the overhead trend line, the crucial supply zone near the $98,500 and the 50% Fibonacci level influences the quick turnaround. With short-term sustenance near the $95,000 mark, the BTC price trend hints at a potential comeback.
Supporting bullish chances, the money flow index reveals a surge in inflow as it takes a bounce back from the oversold region. Currently, BTC prices show a 0.26% surge in the past four hours, with multiple low-price rejections near the $95,000 mark.
BTC is likely to rechallenge the 38.20% Fibonacci level at $96,703. If a bullish breakout occurs, the uptrend will first rechallenge the overhead trend line, resulting in four bearish reversals.
A successful breakout could push BTC toward the $98,500 supply zone near the 50% Fibonacci level.
Conversely, a breakdown of local support at the $95,000 mark will test the 23.60% Fibonacci level at $94,393. Further, it will increase the chances of a quick revisit to the $90k psychological support.
Bitcoin ETFs Witness Massive Outflows
According to a recent tweet by SpotOnChain, U.S. spot Bitcoin ETFs saw a massive outflow of $552.5 million last week. There were outflows on all four trading days, during which BTC prices dropped by nearly 8%.
This decline resulted in a weekly Doji candle, indicating market uncertainty.
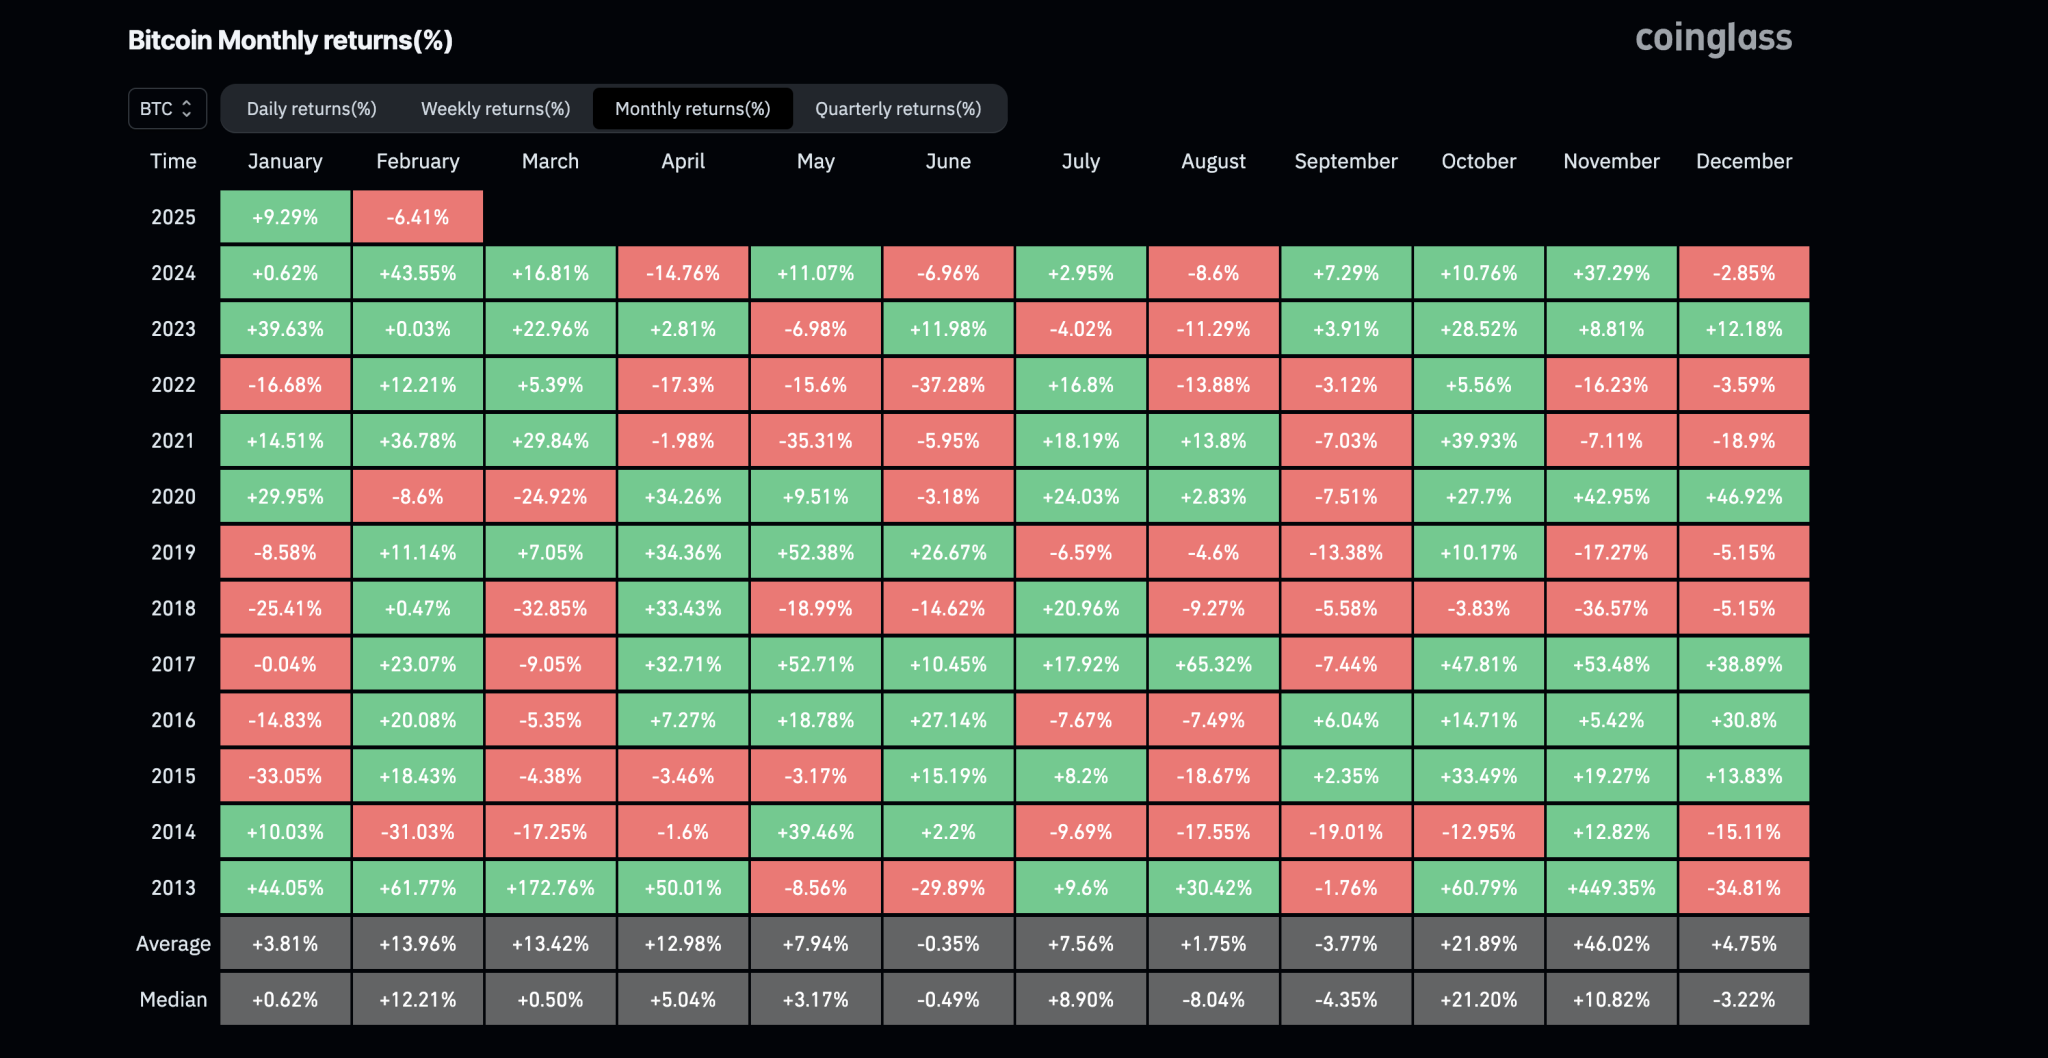
Will March Trigger a Bullish Comeback for Bitcoin?
Despite the ongoing downfall, Bitcoin’s price will likely make a bullish comeback next month. As per Coinglass, over the past four years, Bitcoin recorded significant returns in March.
If the bullish trend continues, the upcoming month could witness a bullish spree with a breakout of the 50% Fibonacci level. A breakout above the 50% Fibonacci level could open doors for further gains, targeting the 78.60% Fibonacci level at $103,393 and the supply zone near the $108,000 mark.