Bitcoin’s price fluctuates between $93,607 and $94,026 over the past hour, reflecting a market capitalization of $1.86 trillion. With a 24-hour trading volume of $63.28 billion and an intraday range spanning $91,215 to $95,098, bitcoin finds itself at a pivotal juncture.
Bitcoin
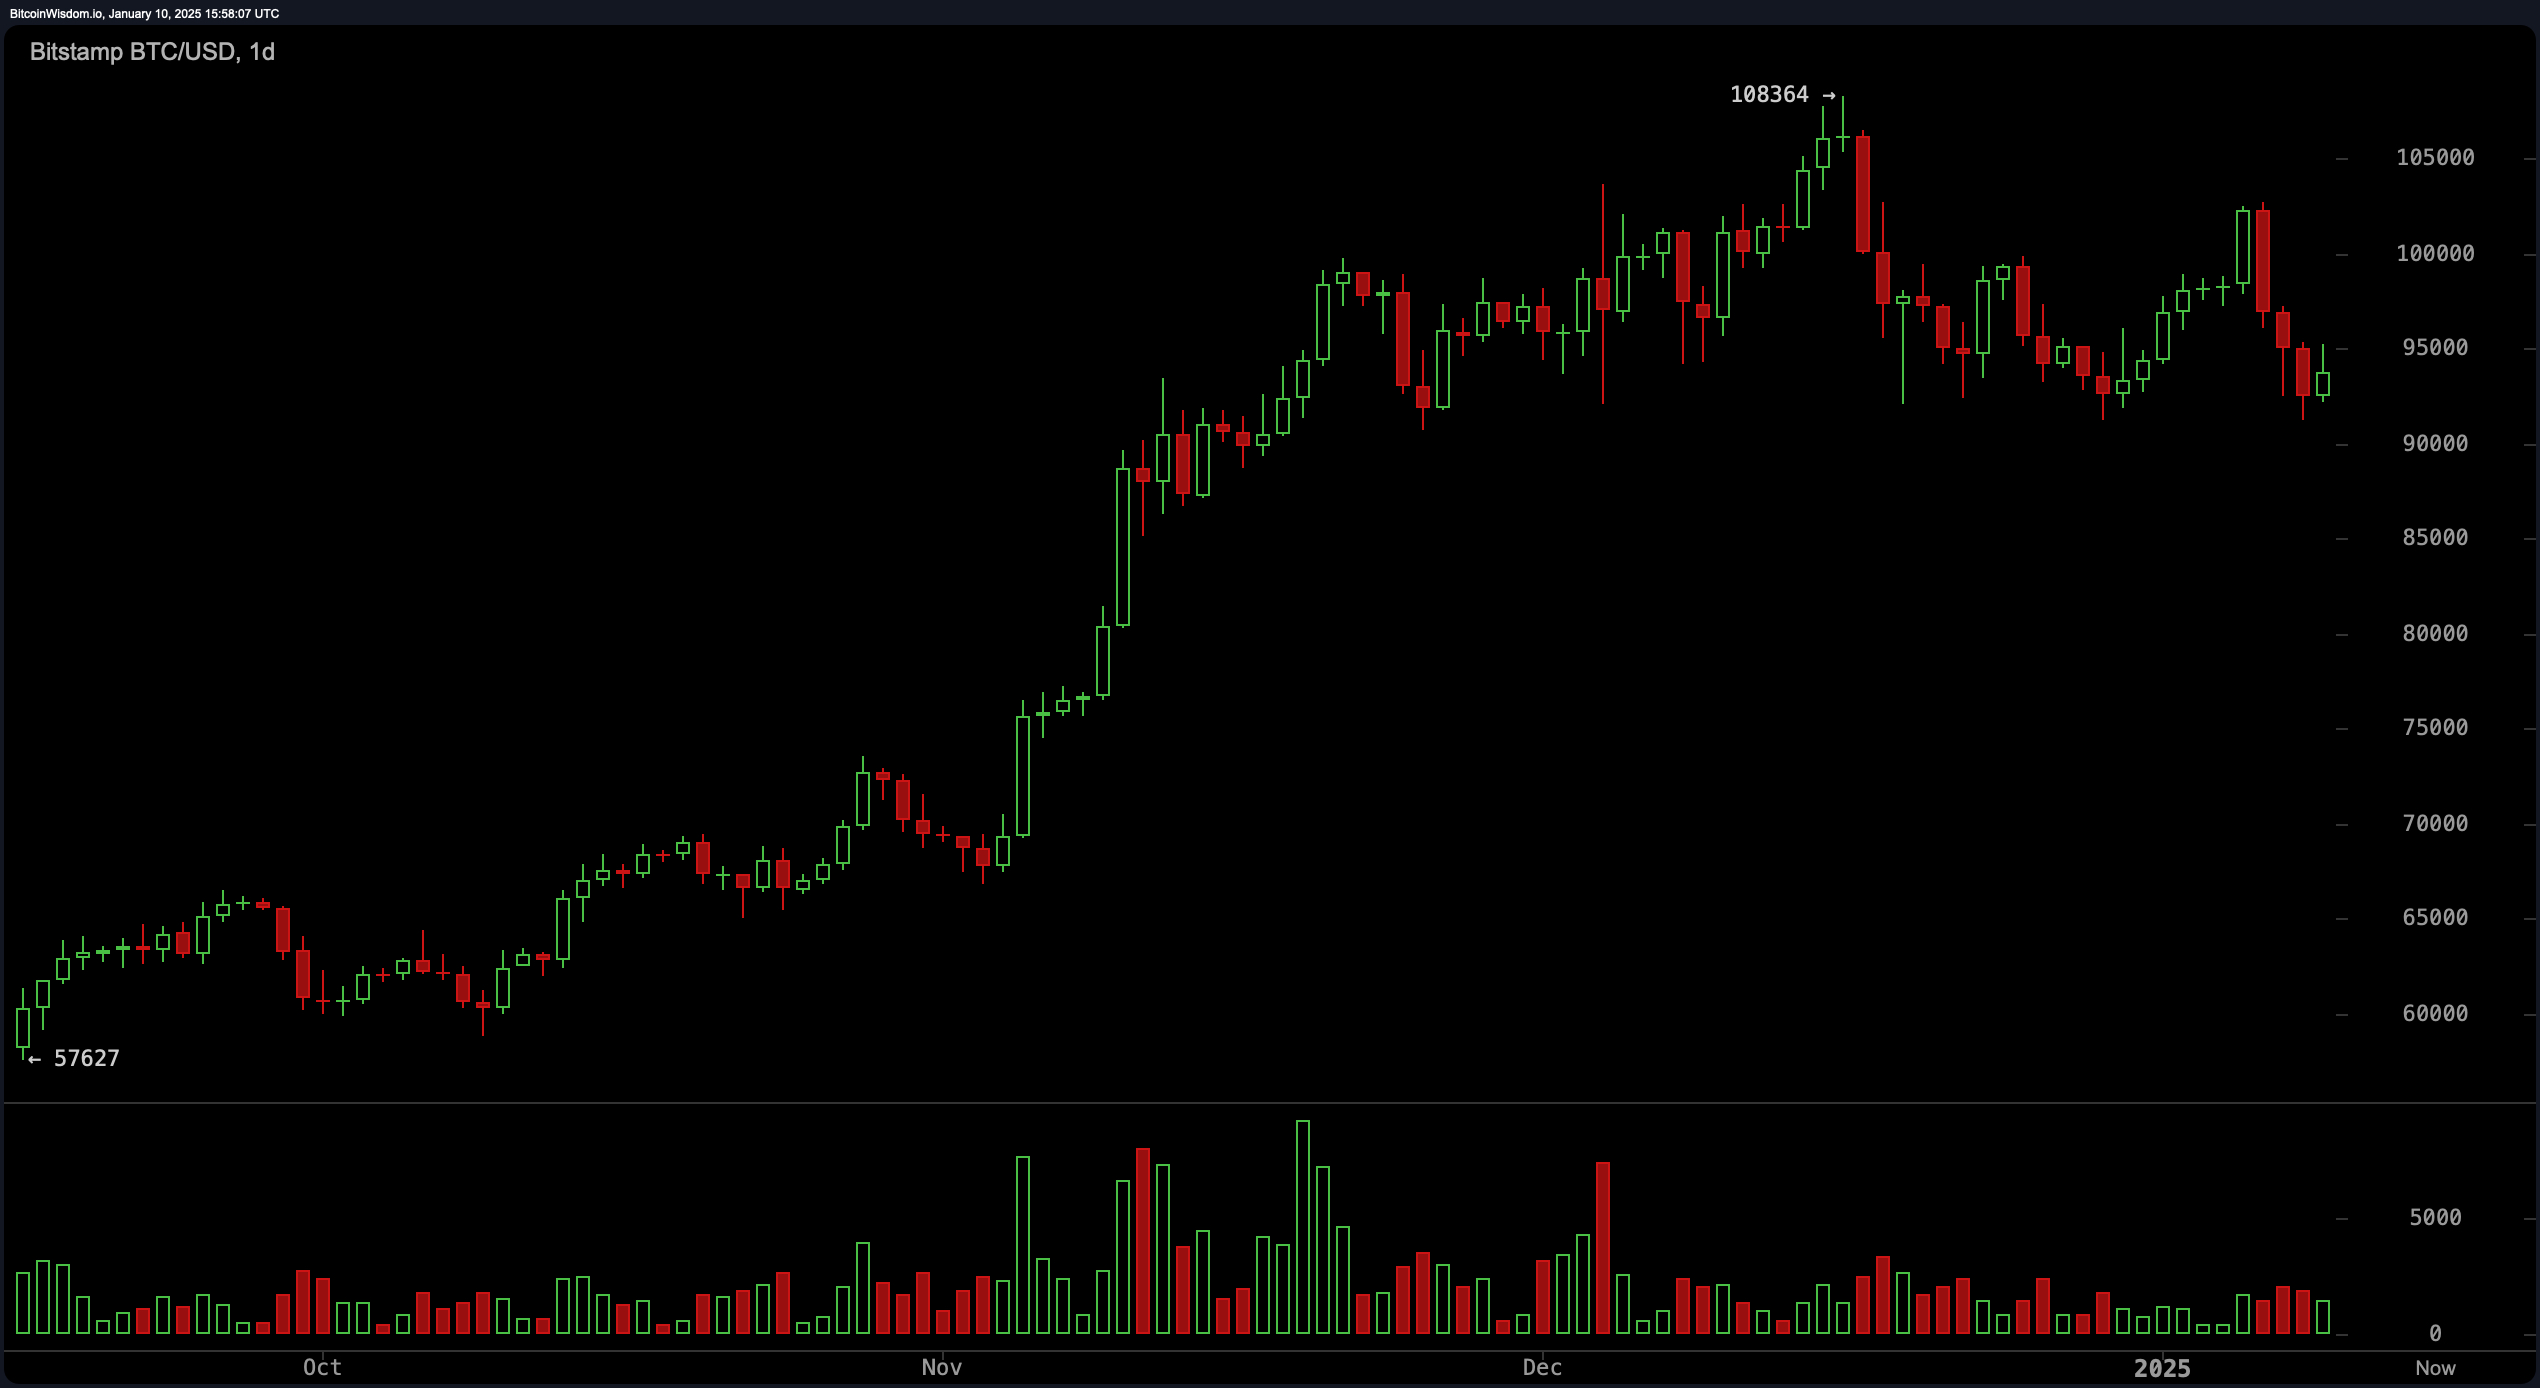
The daily chart illustrates bitcoin consolidating near its support band of $91,000 to $93,000 after retreating sharply from its recent high of $108,364. Elevated volumes observed at the peak suggest a distribution phase, while the subsequent stagnation hints at waning bullish strength. Short-term moving averages—10-day and 20-day exponential (EMA) and simple moving averages (SMA)—indicate bearish trends, applying downward pressure. However, the 100-day and 200-day moving averages remain in alignment with a broader bullish narrative, suggesting resilience in bitcoin’s overarching trajectory.

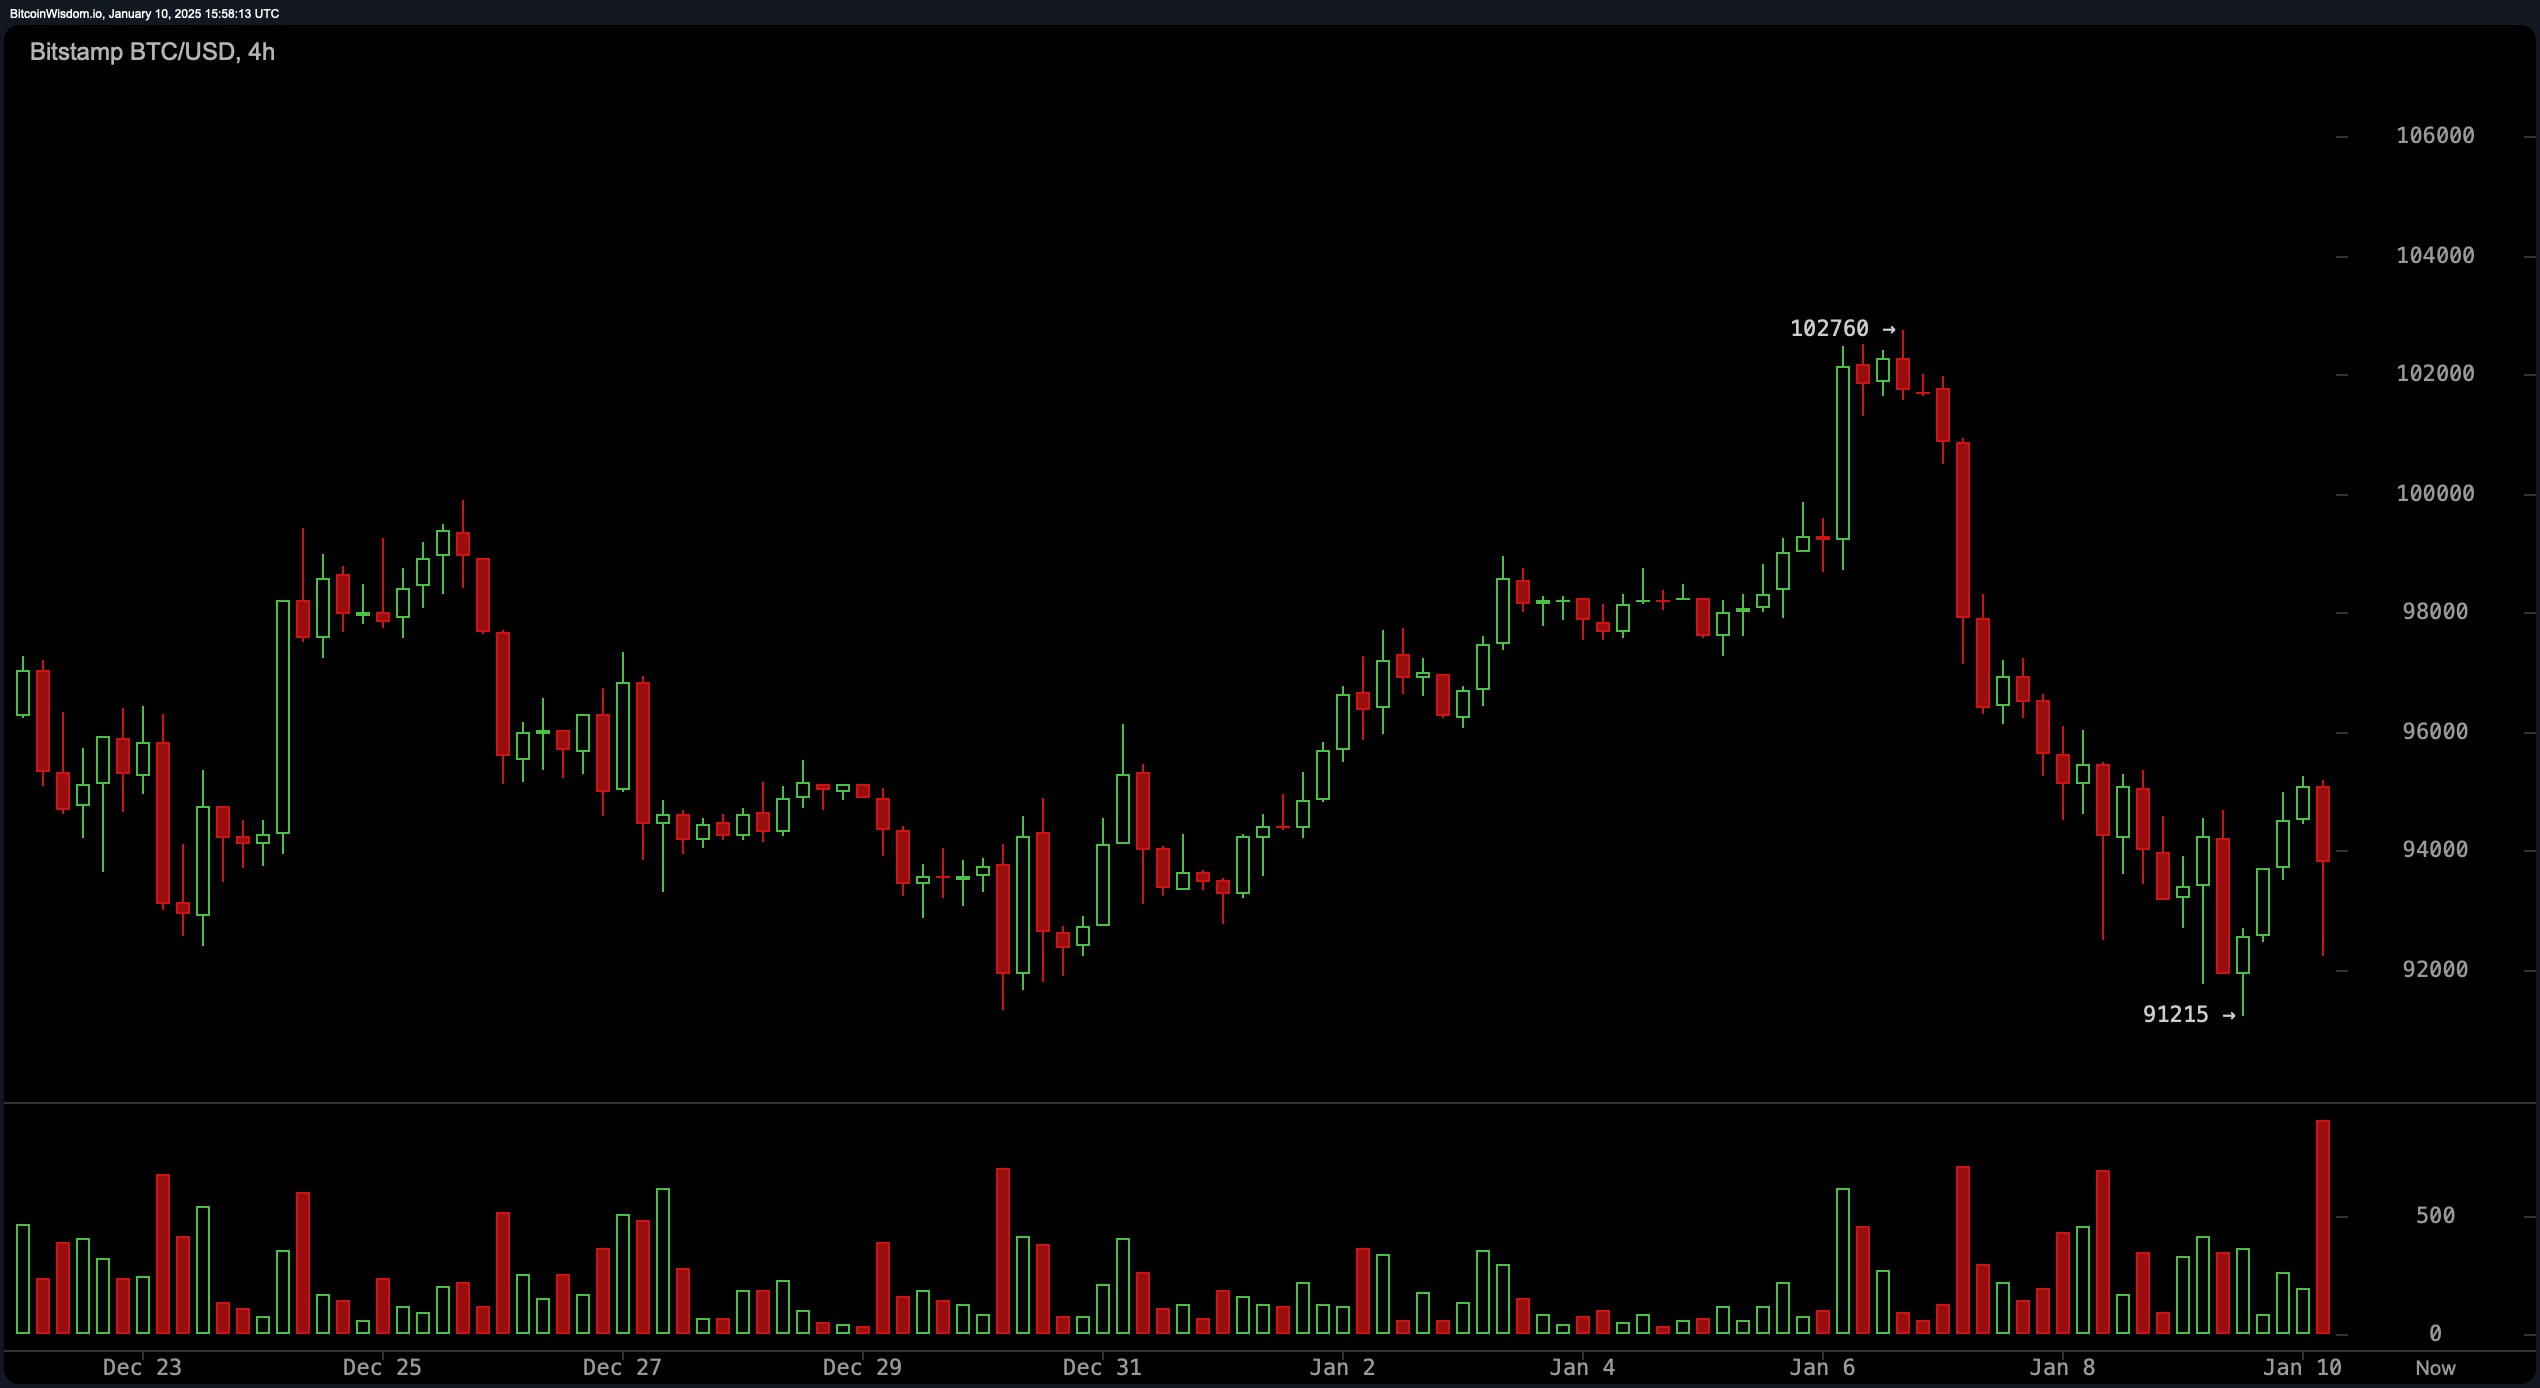
The four-hour chart reveals signs of a corrective rebound following the dip to $91,215. However, muted trading volumes during this recovery cast doubts on its durability. Resistance levels between $95,000 and $96,000 align with lower highs formed after the retreat from $102,760, echoing the persistent bearish sentiment. A decisive breach above $96,000, supported by heightened volume, could alter the outlook, placing $102,760 as the next key target.

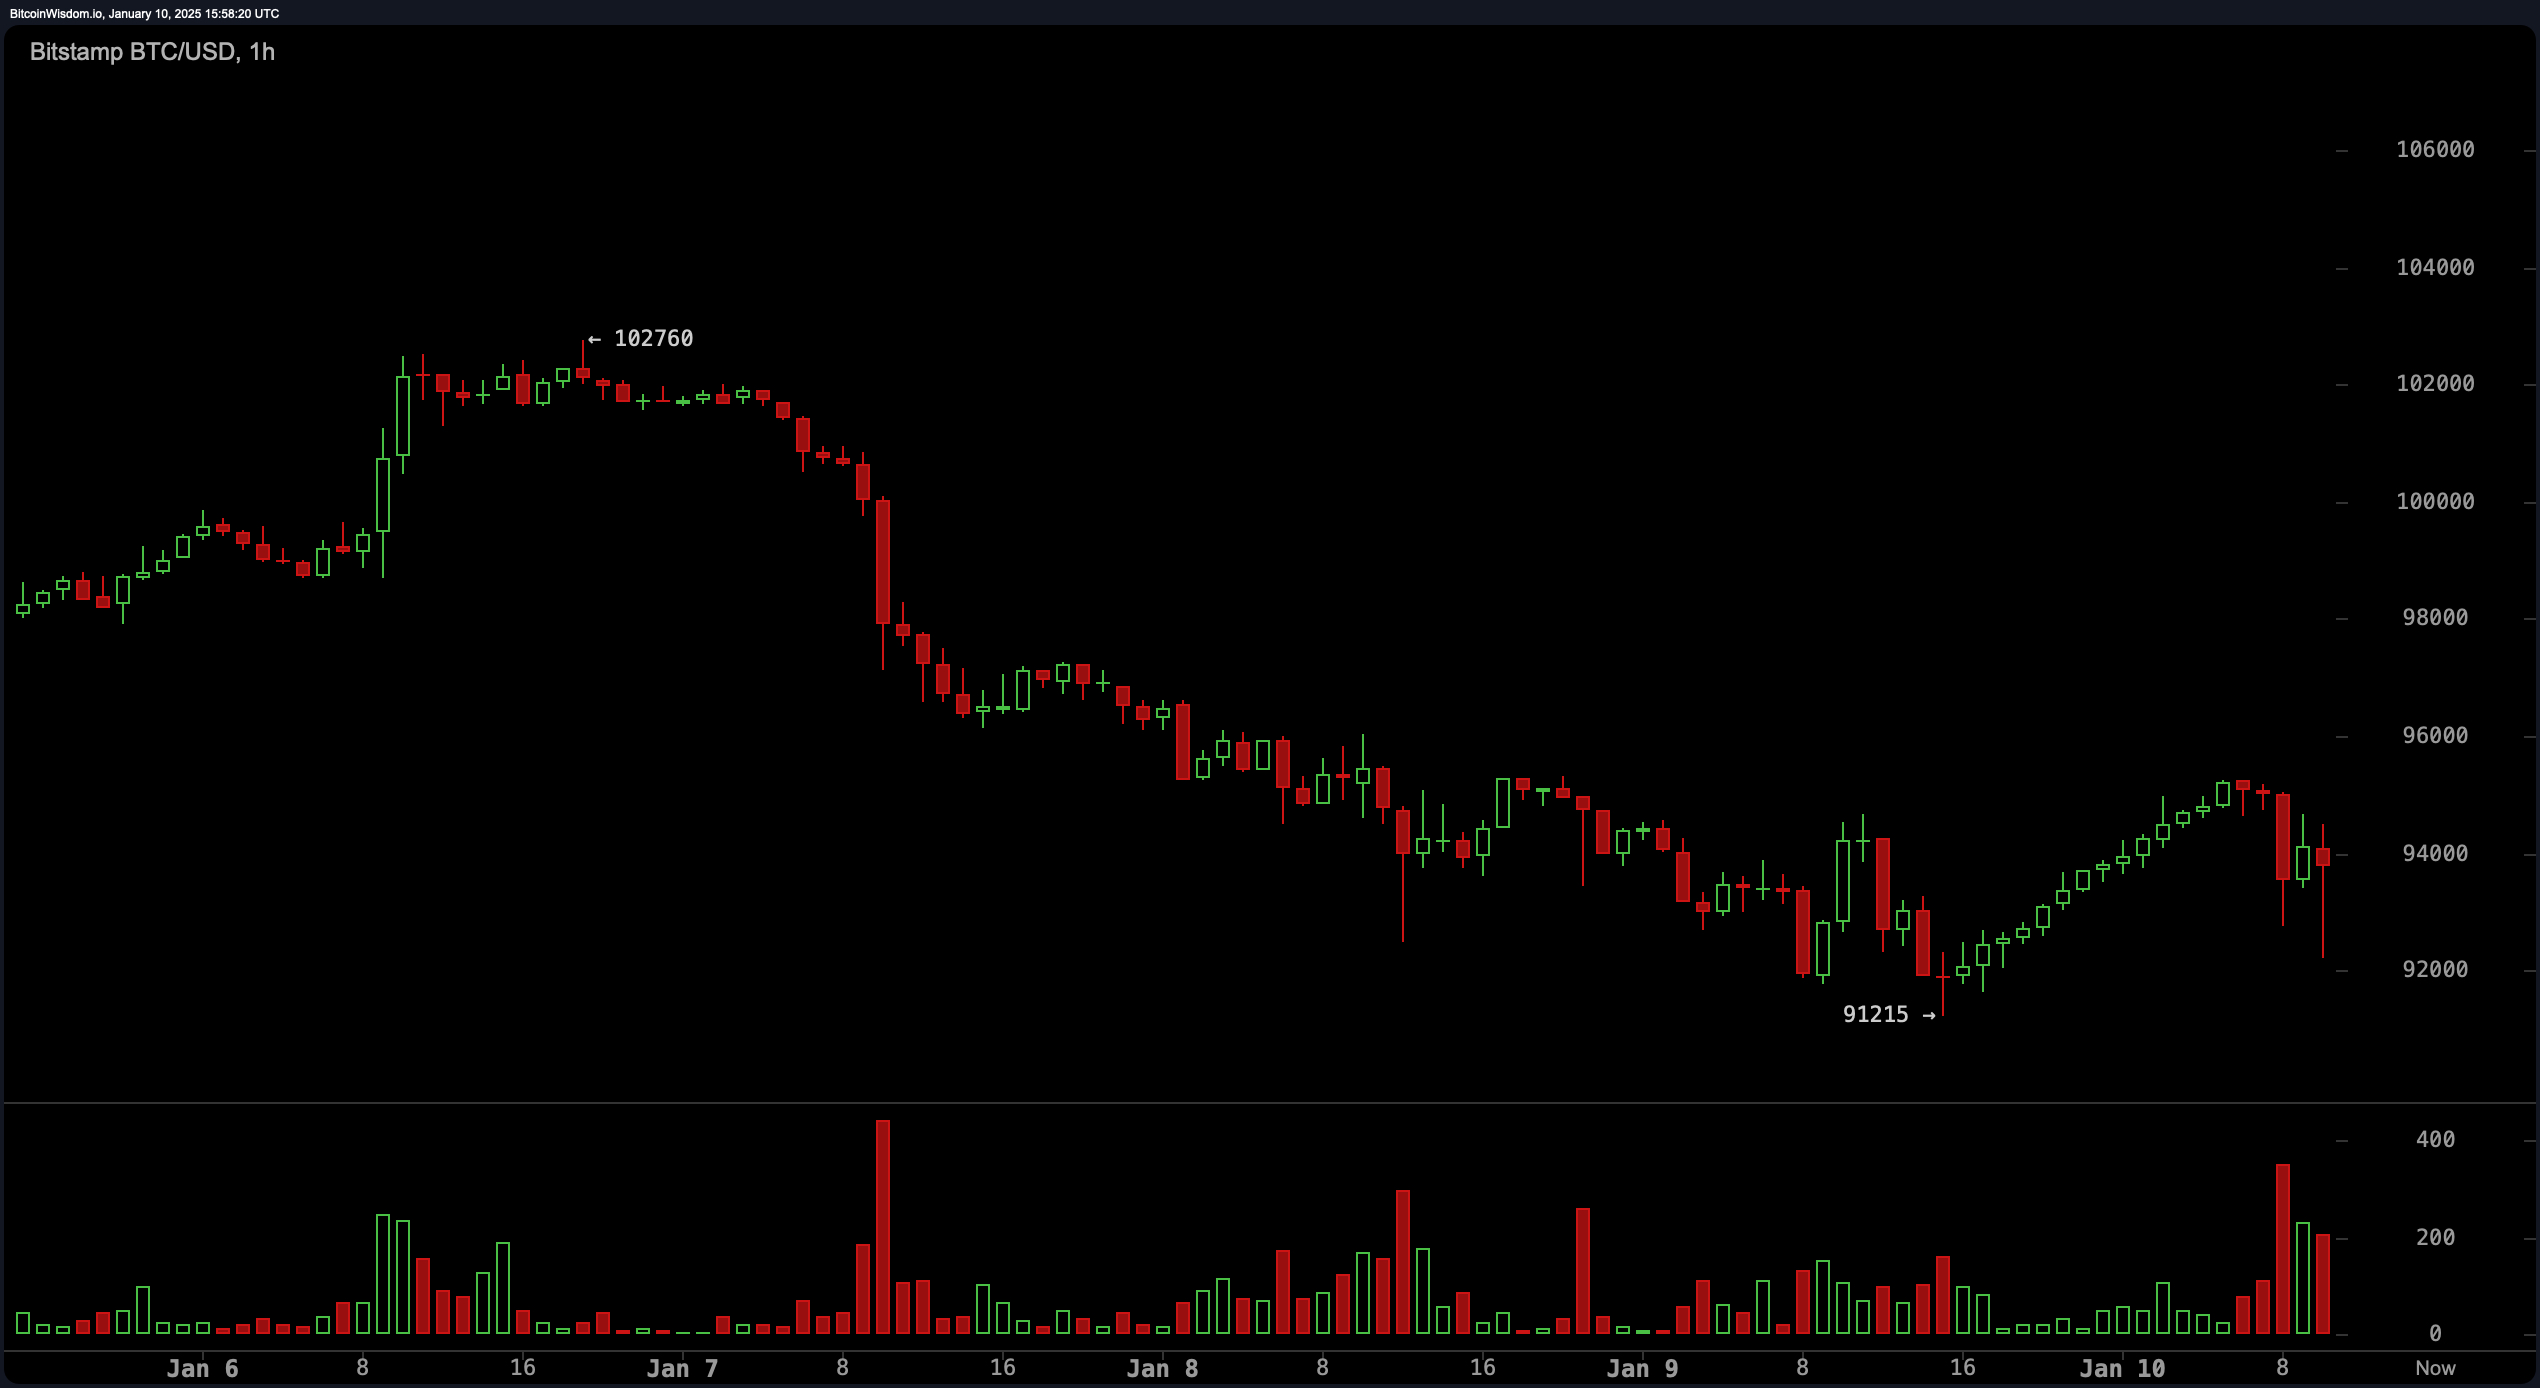
On an hourly scale, bitcoin’s volatility intensifies as it strives to recover from recent troughs. Resistance solidifies near $95,000, while support holds steady in the $91,000 to $92,000 range. Momentum indicators like the relative strength index (RSI) and Stochastic oscillator remain neutral, whereas the moving average convergence divergence (MACD) suggests bearish conditions. Nonetheless, a modest uptick in positive momentum on shorter timeframes hints at potential buying opportunities.

Oscillators paint a mixed picture. Neutral signals dominate indicators such as RSI, stochastic, and the commodity channel index (CCI), though momentum leans toward a buying bias. The awesome oscillator remains balanced, reflecting market indecision. Traders should remain vigilant, awaiting volume confirmations before making directional moves.
The interplay of these technical signals suggests a cautious approach, as downside risks dominate unless bitcoin decisively reclaims the $95,000 to $96,000 range. Significant price movements could emerge with volume surges, either propelling bitcoin toward $102,000 or testing the critical $91,000 support level.
Bull Verdict:
If bitcoin successfully reclaims the $95,000 to $96,000 resistance zone with strong trading volume, it could set the stage for a rally toward $102,760 and beyond, reaffirming bullish dominance in the broader trend. Traders eyeing long positions should watch for a sustained breakout supported by increased momentum.
Bear Verdict:
Failure to break above $96,000, coupled with a lack of volume, could see bitcoin revisiting its support levels near $91,000. A breach of this critical support may open the door to further declines, solidifying the bearish outlook in the near term.
