
Bitcoin is trading at $97,030 with a market capitalization of $1.927 trillion, supported by a 24-hour trade volume of $28.862 billion. During this session, bitcoin saw a price range between $93,592 and $97,511, reflecting ongoing volatility within a consolidative structure near recent highs.
Bitcoin
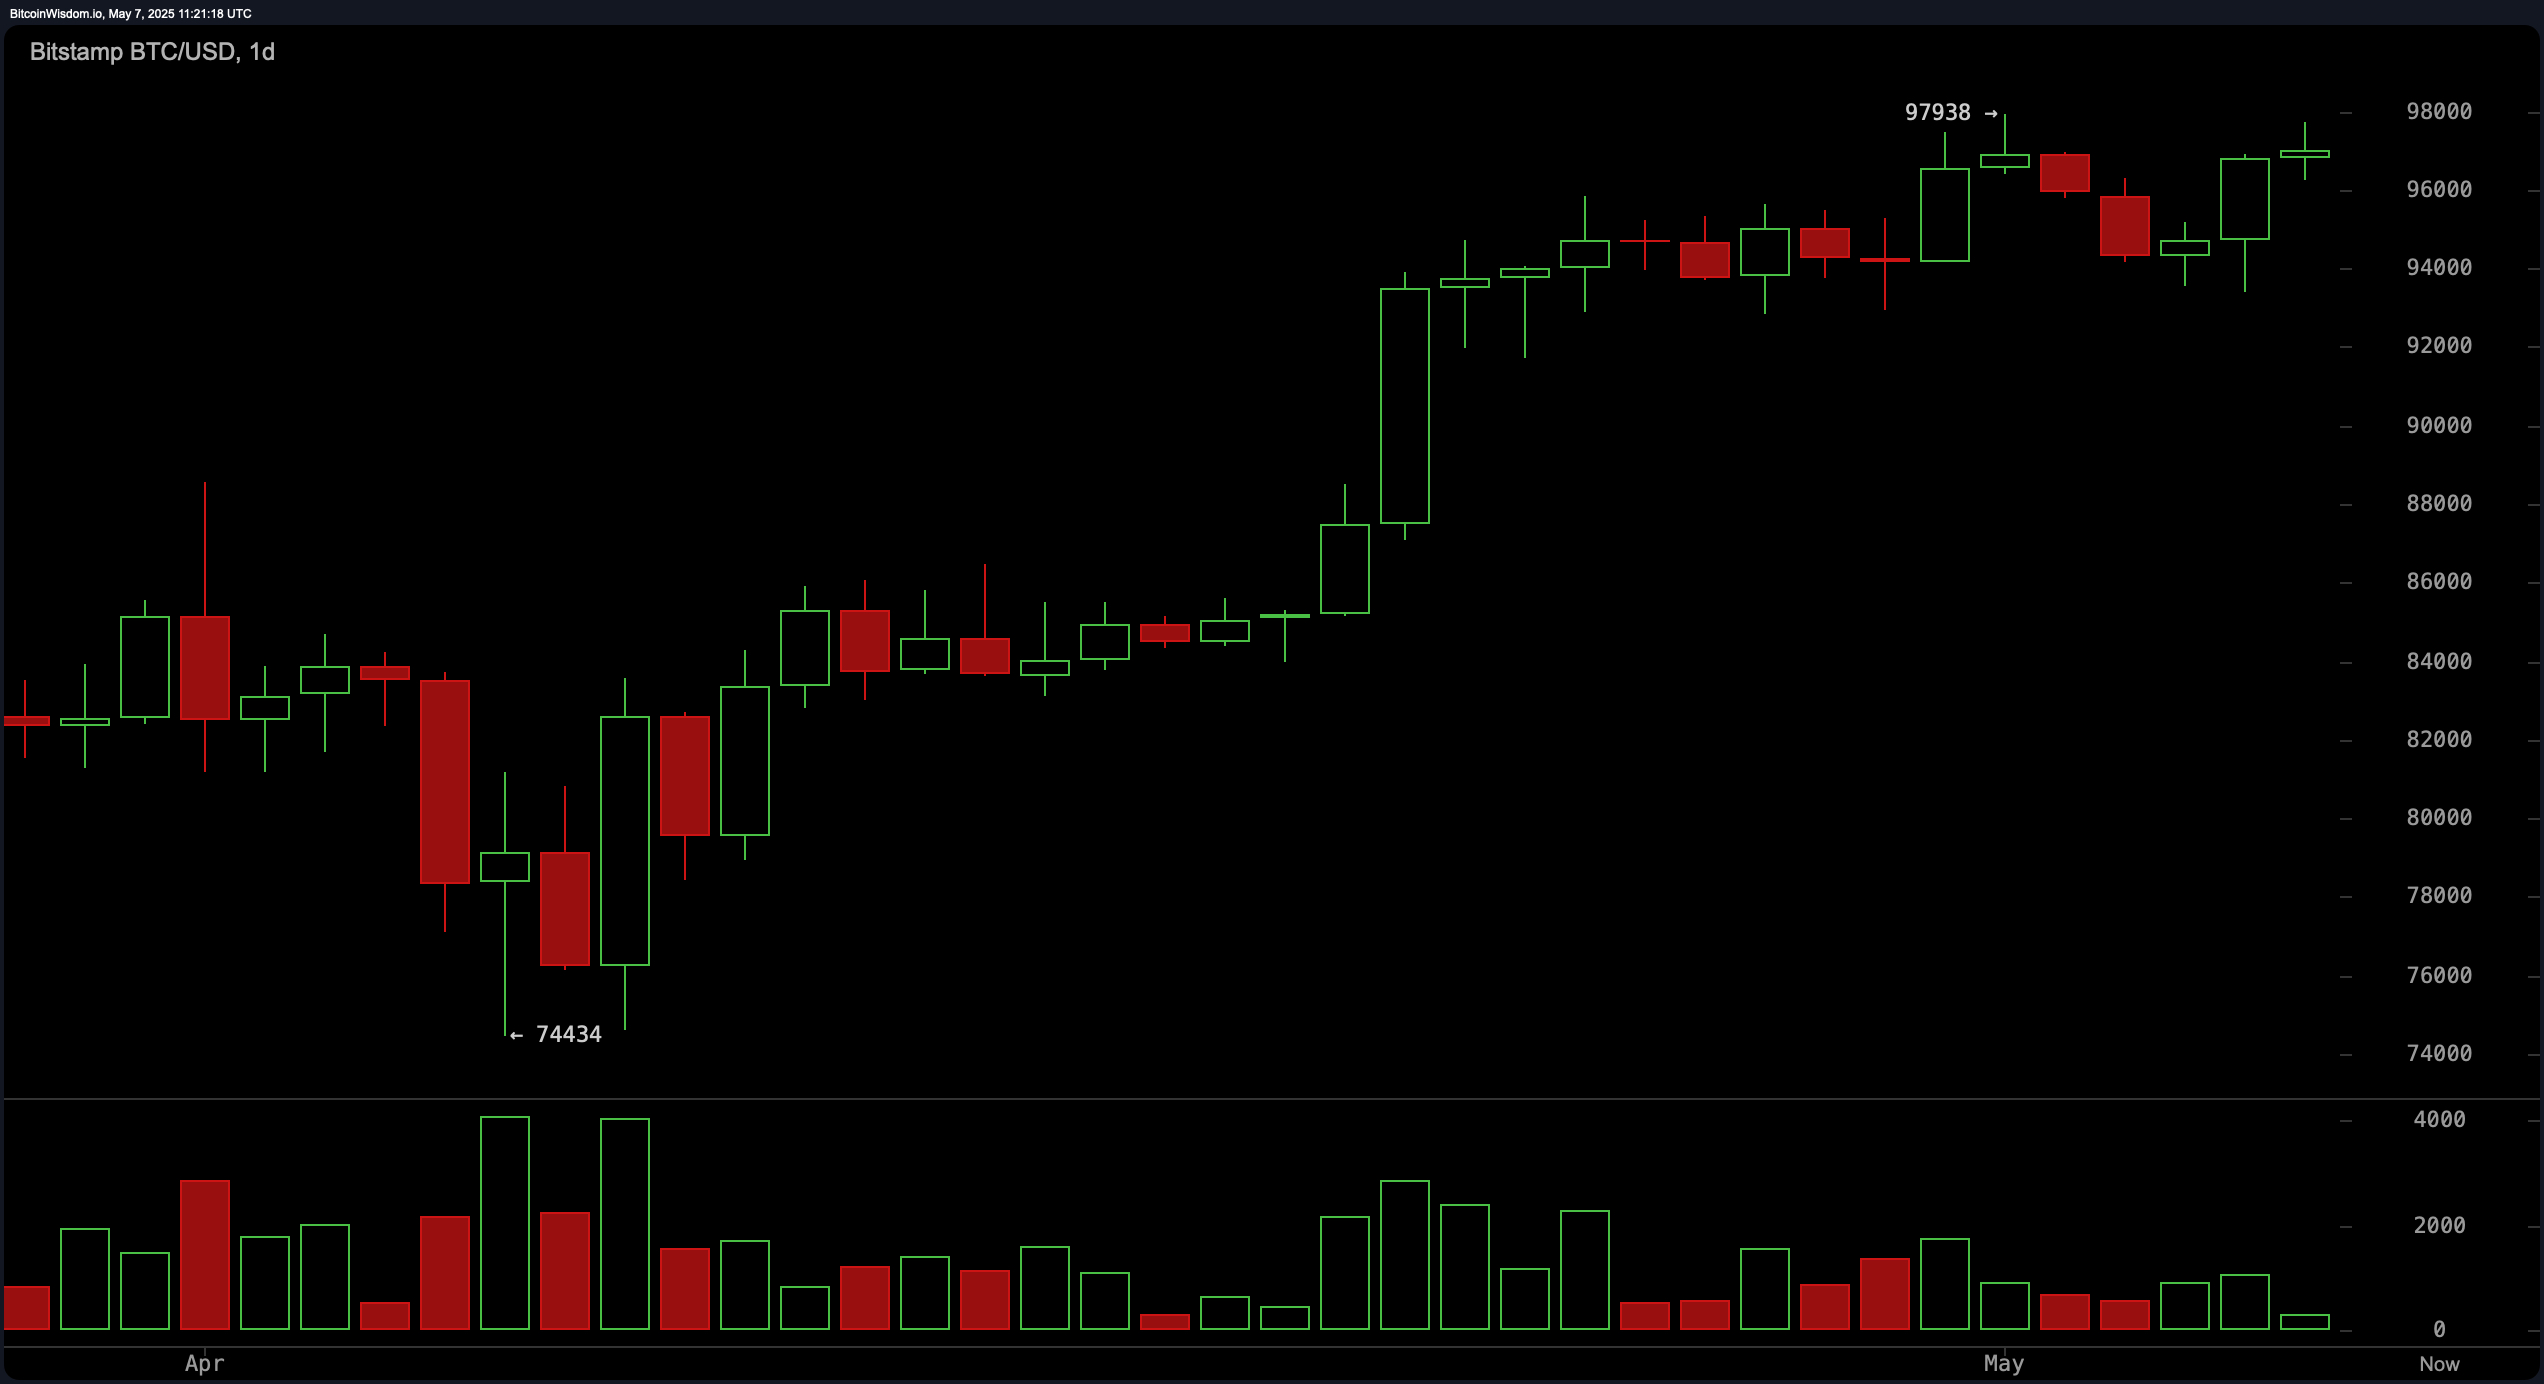
Bitcoin’s multi-timeframe chart action continues to reflect bullish strength, particularly on the daily chart, where the asset maintains a strong uptrend that began in mid-April. Prices rallied from approximately $74,434 to reach a local peak near $97,938 before entering a consolidation phase. While volume has tapered slightly post-surge, the price structure remains constructive, showing no immediate signs of distribution. Key support lies at $92,000, with resistance observed near $98,000. A breakout above this resistance with volume confirmation could catalyze a move toward the psychological $100,000 level.
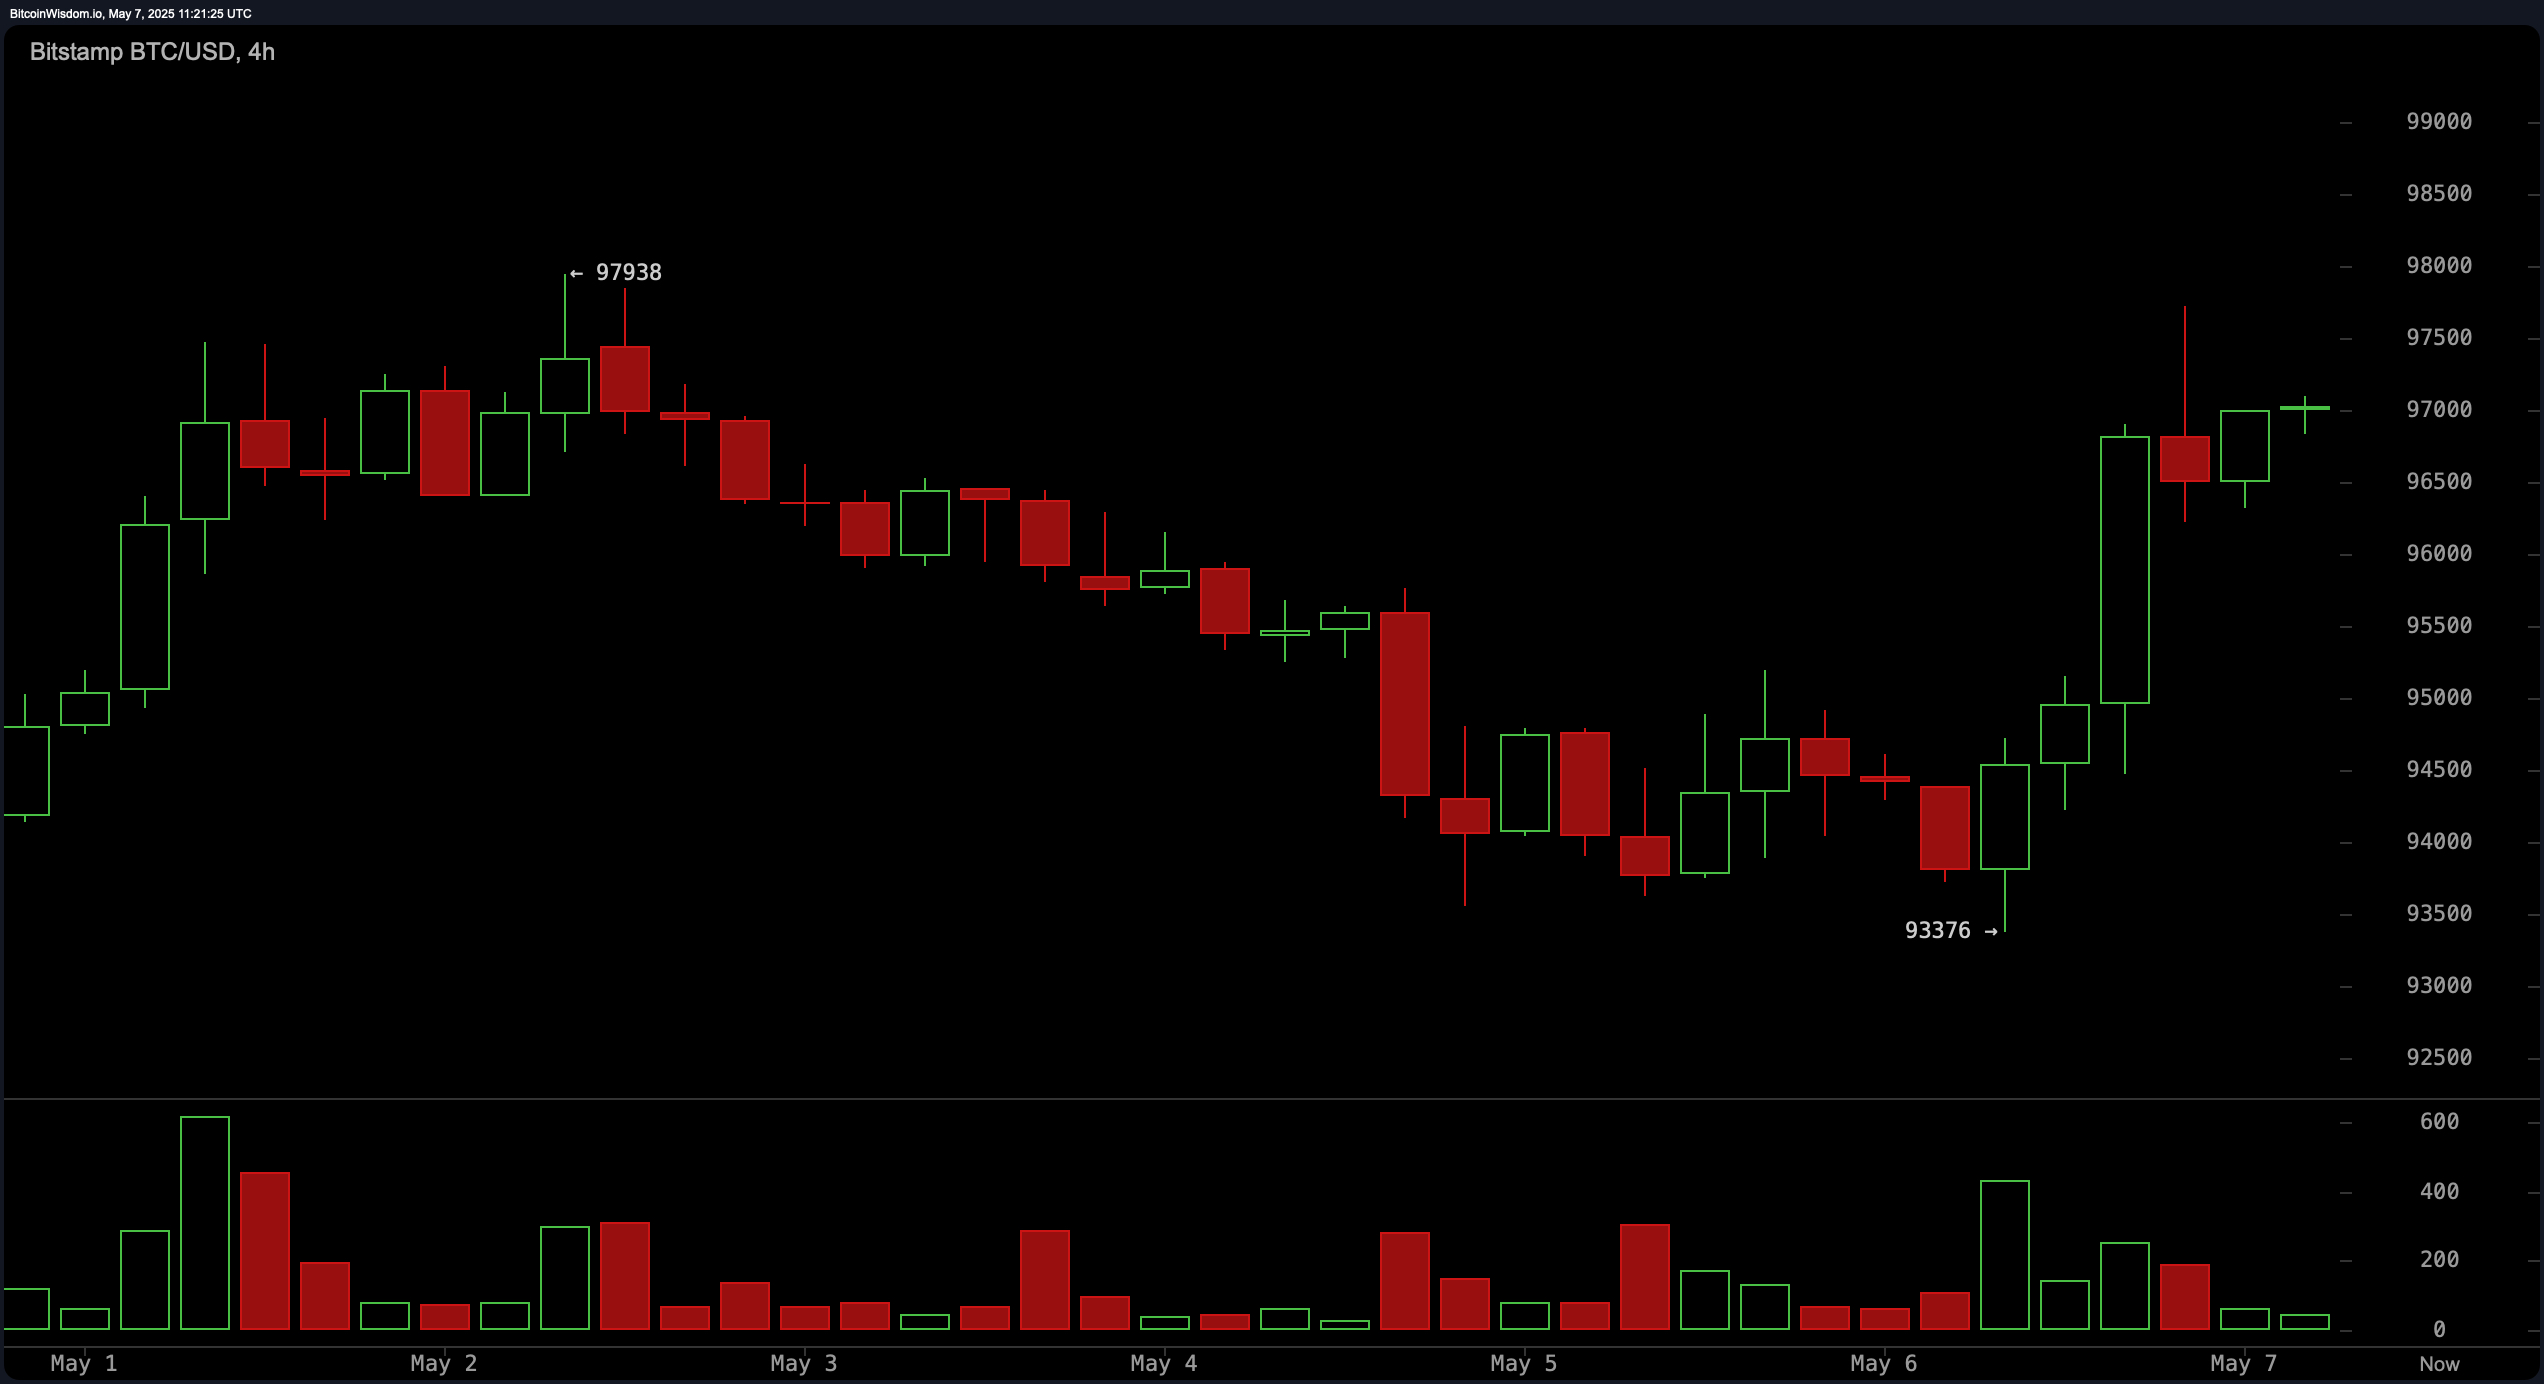
On the four-hour chart, bitcoin displays a V-shaped recovery after a pullback to roughly $93,376. This rebound has been marked by strong bullish candles and increasing volume, signaling renewed buyer interest. The price is now challenging prior highs, and a successful break above $97,938 would confirm bullish continuation. However, failure to breach this resistance could form a potential double top, especially if accompanied by a spike in sell-side volume. Support has firmed around $95,500, aligning with previous resistance levels now acting as a launchpad for higher price action.
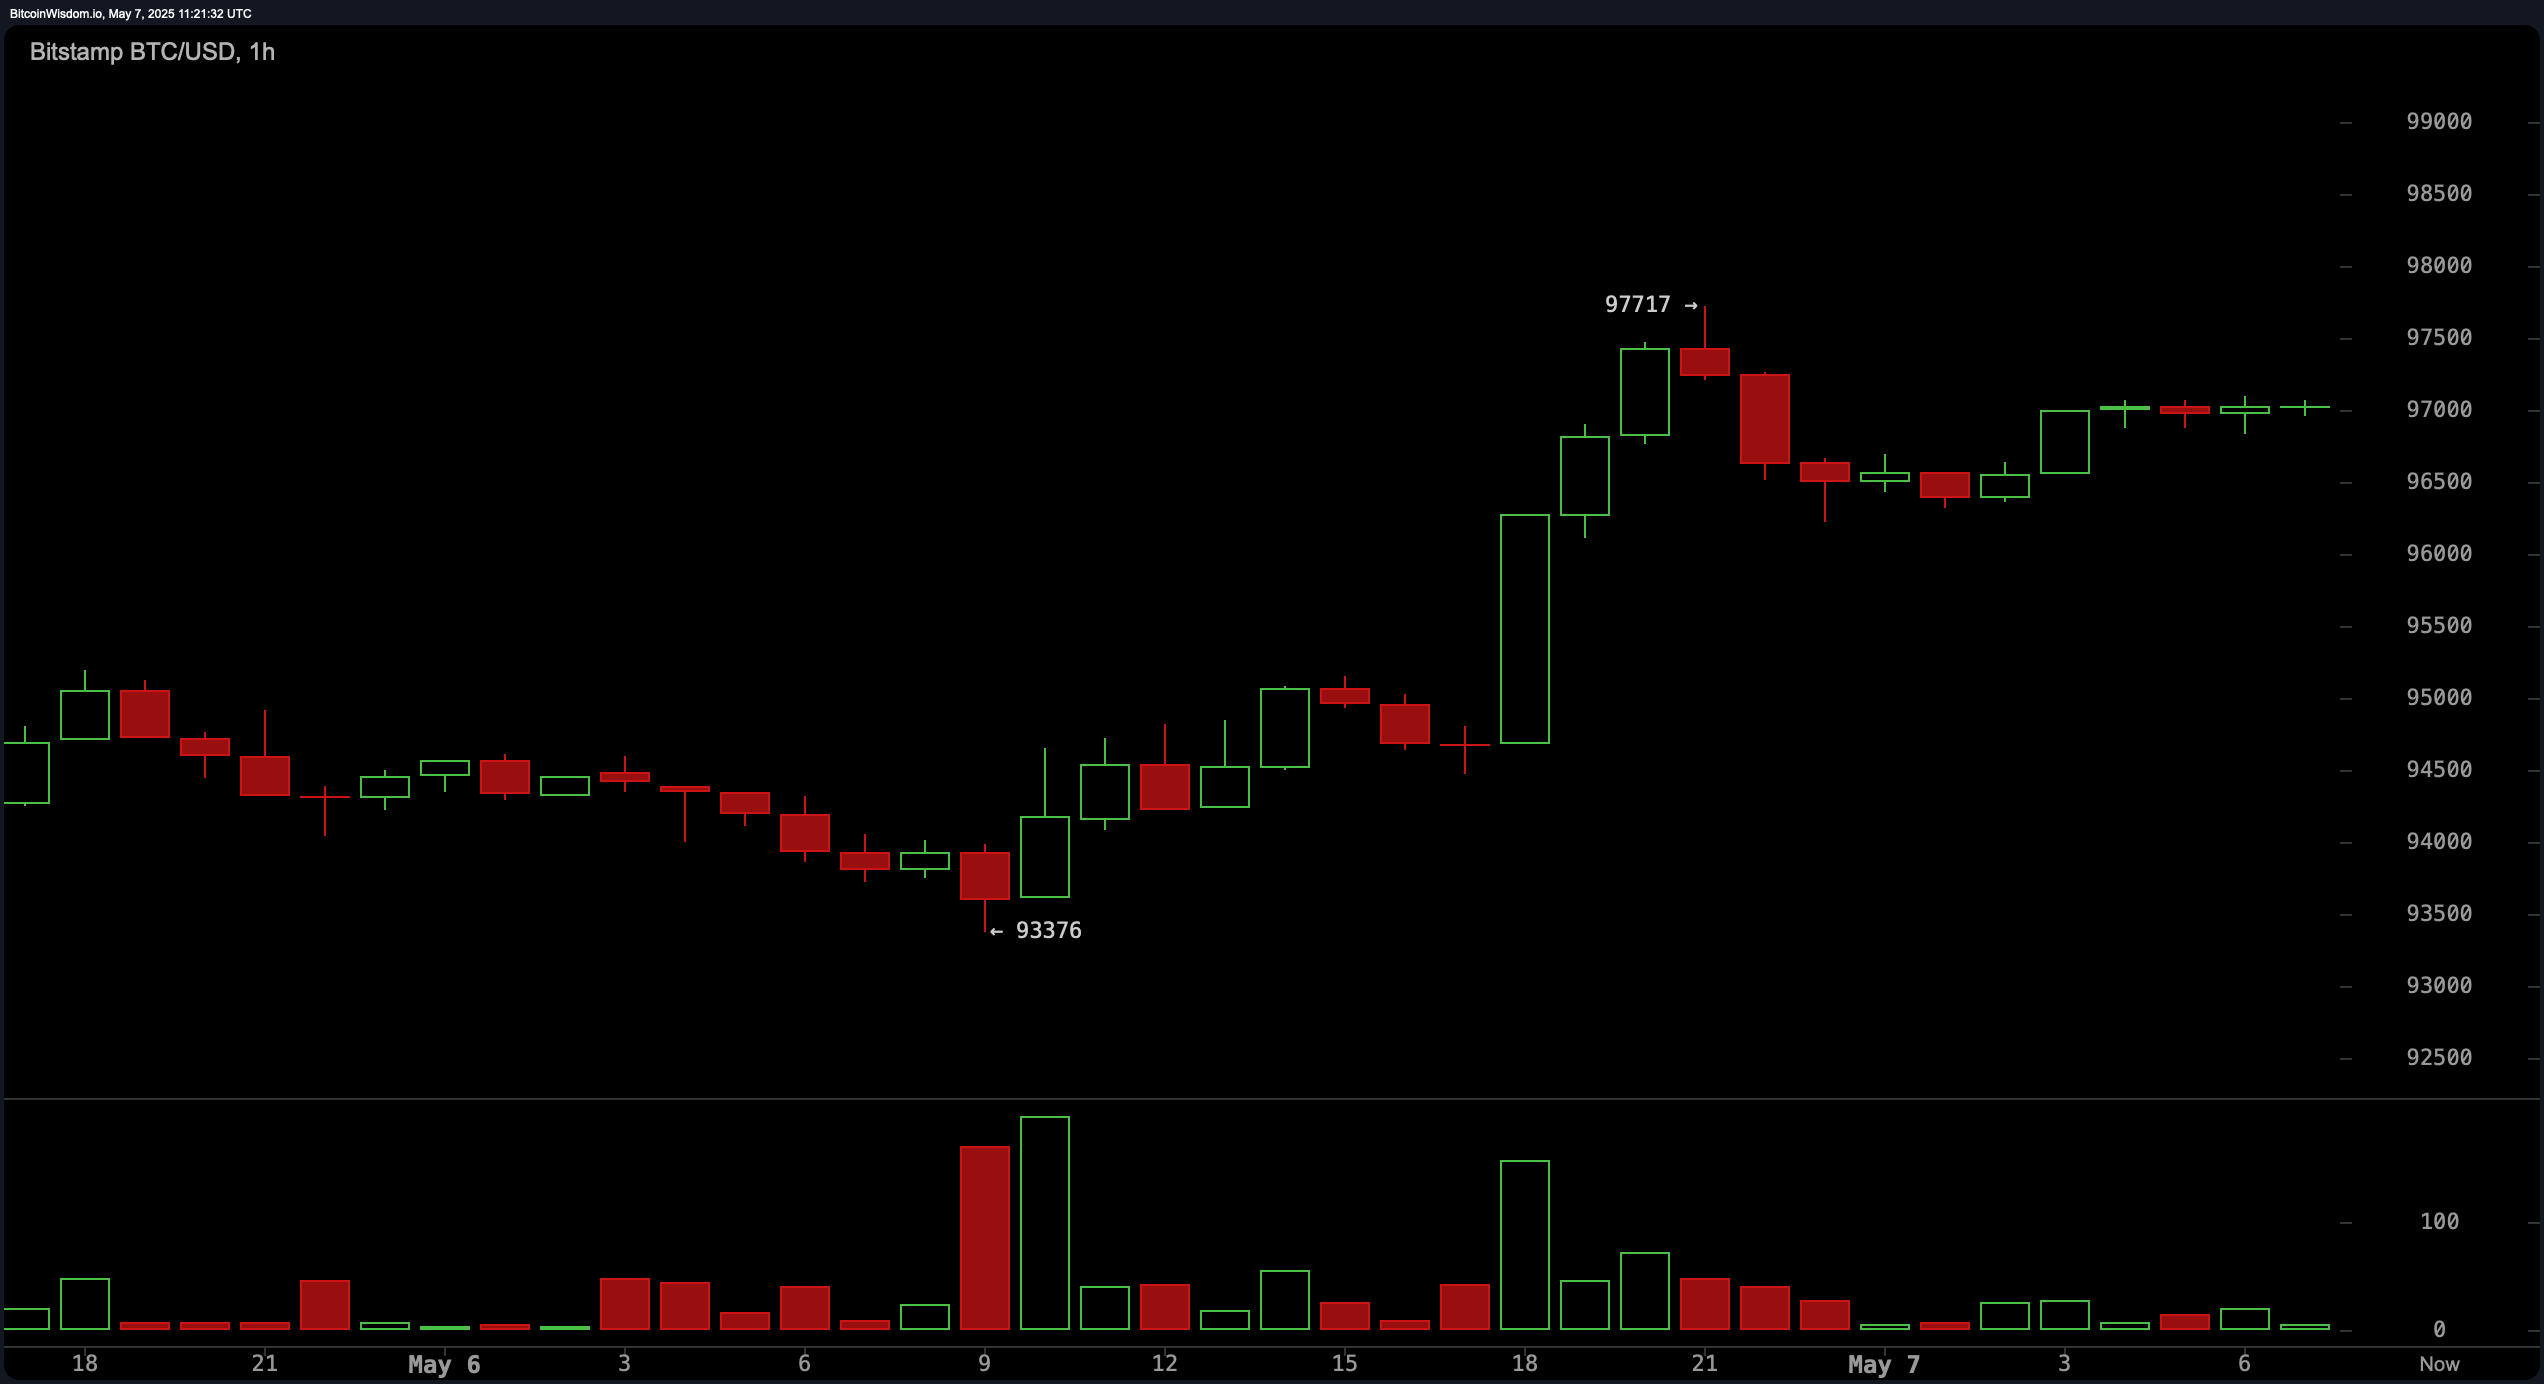
The one-hour chart reveals micro consolidation just below resistance, with bitcoin fluctuating near the $97,000 level. Candle patterns display small bodies with long lower wicks, suggesting that buyers are stepping in on every dip. However, declining volume hints at short-term indecision or momentum exhaustion. A breakout above $97,700 could enable scalping opportunities targeting the $99,000 level, while a fall below $95,500 on significant volume could trigger a short setup, reinforcing the importance of that support level.
From a technical indicator perspective, oscillators largely signal neutrality, with the relative strength index (RSI), Stochastic, commodity channel index (CCI), average directional index (ADX), and Awesome oscillator all reflecting balanced momentum conditions. The momentum indicator (10) and moving average convergence divergence (MACD) level (12, 26), however, both issue buy signals, underlining the underlying bullish sentiment. This convergence of neutral and positive signals often precedes breakout scenarios, lending further credence to a potential upside resolution.
The moving average suite remains uniformly bullish. All key exponential moving averages (EMAs) and simple moving averages (SMAs) across the 10, 20, 30, 50, 100, and 200-period windows indicate positive signals, with current price levels well above their respective trend baselines. This broad alignment suggests robust market strength and a supportive structure for continued upward movement, especially in the absence of a breakdown below short-term moving averages.
Fibonacci retracement levels add further structure to the current market scenario. On the daily chart, key retracement zones between $92,391 and $89,595 mark potential healthy pullbacks. The four-hour timeframe shows price recently bouncing from the 61.8% retracement level ($95,118), supporting a continuation toward $98,000. On the one-hour chart, consolidation is occurring between the 23.6% and 38.2% retracement levels, offering a foundation for bullish setups on minor dips. Collectively, these levels define clear zones for entries, stop-losses, and profit-taking strategies.
Bull Verdict:
With strong support from all major moving averages, rising momentum indicators, and price action consolidating just below resistance, bitcoin remains poised for a breakout. A sustained move above $98,000 with volume could accelerate the path toward the $100,000 milestone.
Bear Verdict:
Despite bullish structure, waning volume, and potential double-top formation near $97,900 raises caution. A breakdown below $95,500 on heavy sell volume could shift momentum in favor of sellers and initiate a short-term correction.