
Bitcoin is trading at $109,748 to $109,818 at 9:15 a.m. ET as of Tuesday, June 10, 2025, with a market capitalization of $2.18 trillion and a 24-hour trade volume of $38.10 billion. The cryptocurrency’s intraday price range has fluctuated between $107,115 and $110,282, suggesting continued volatility amid key resistance levels.
Bitcoin
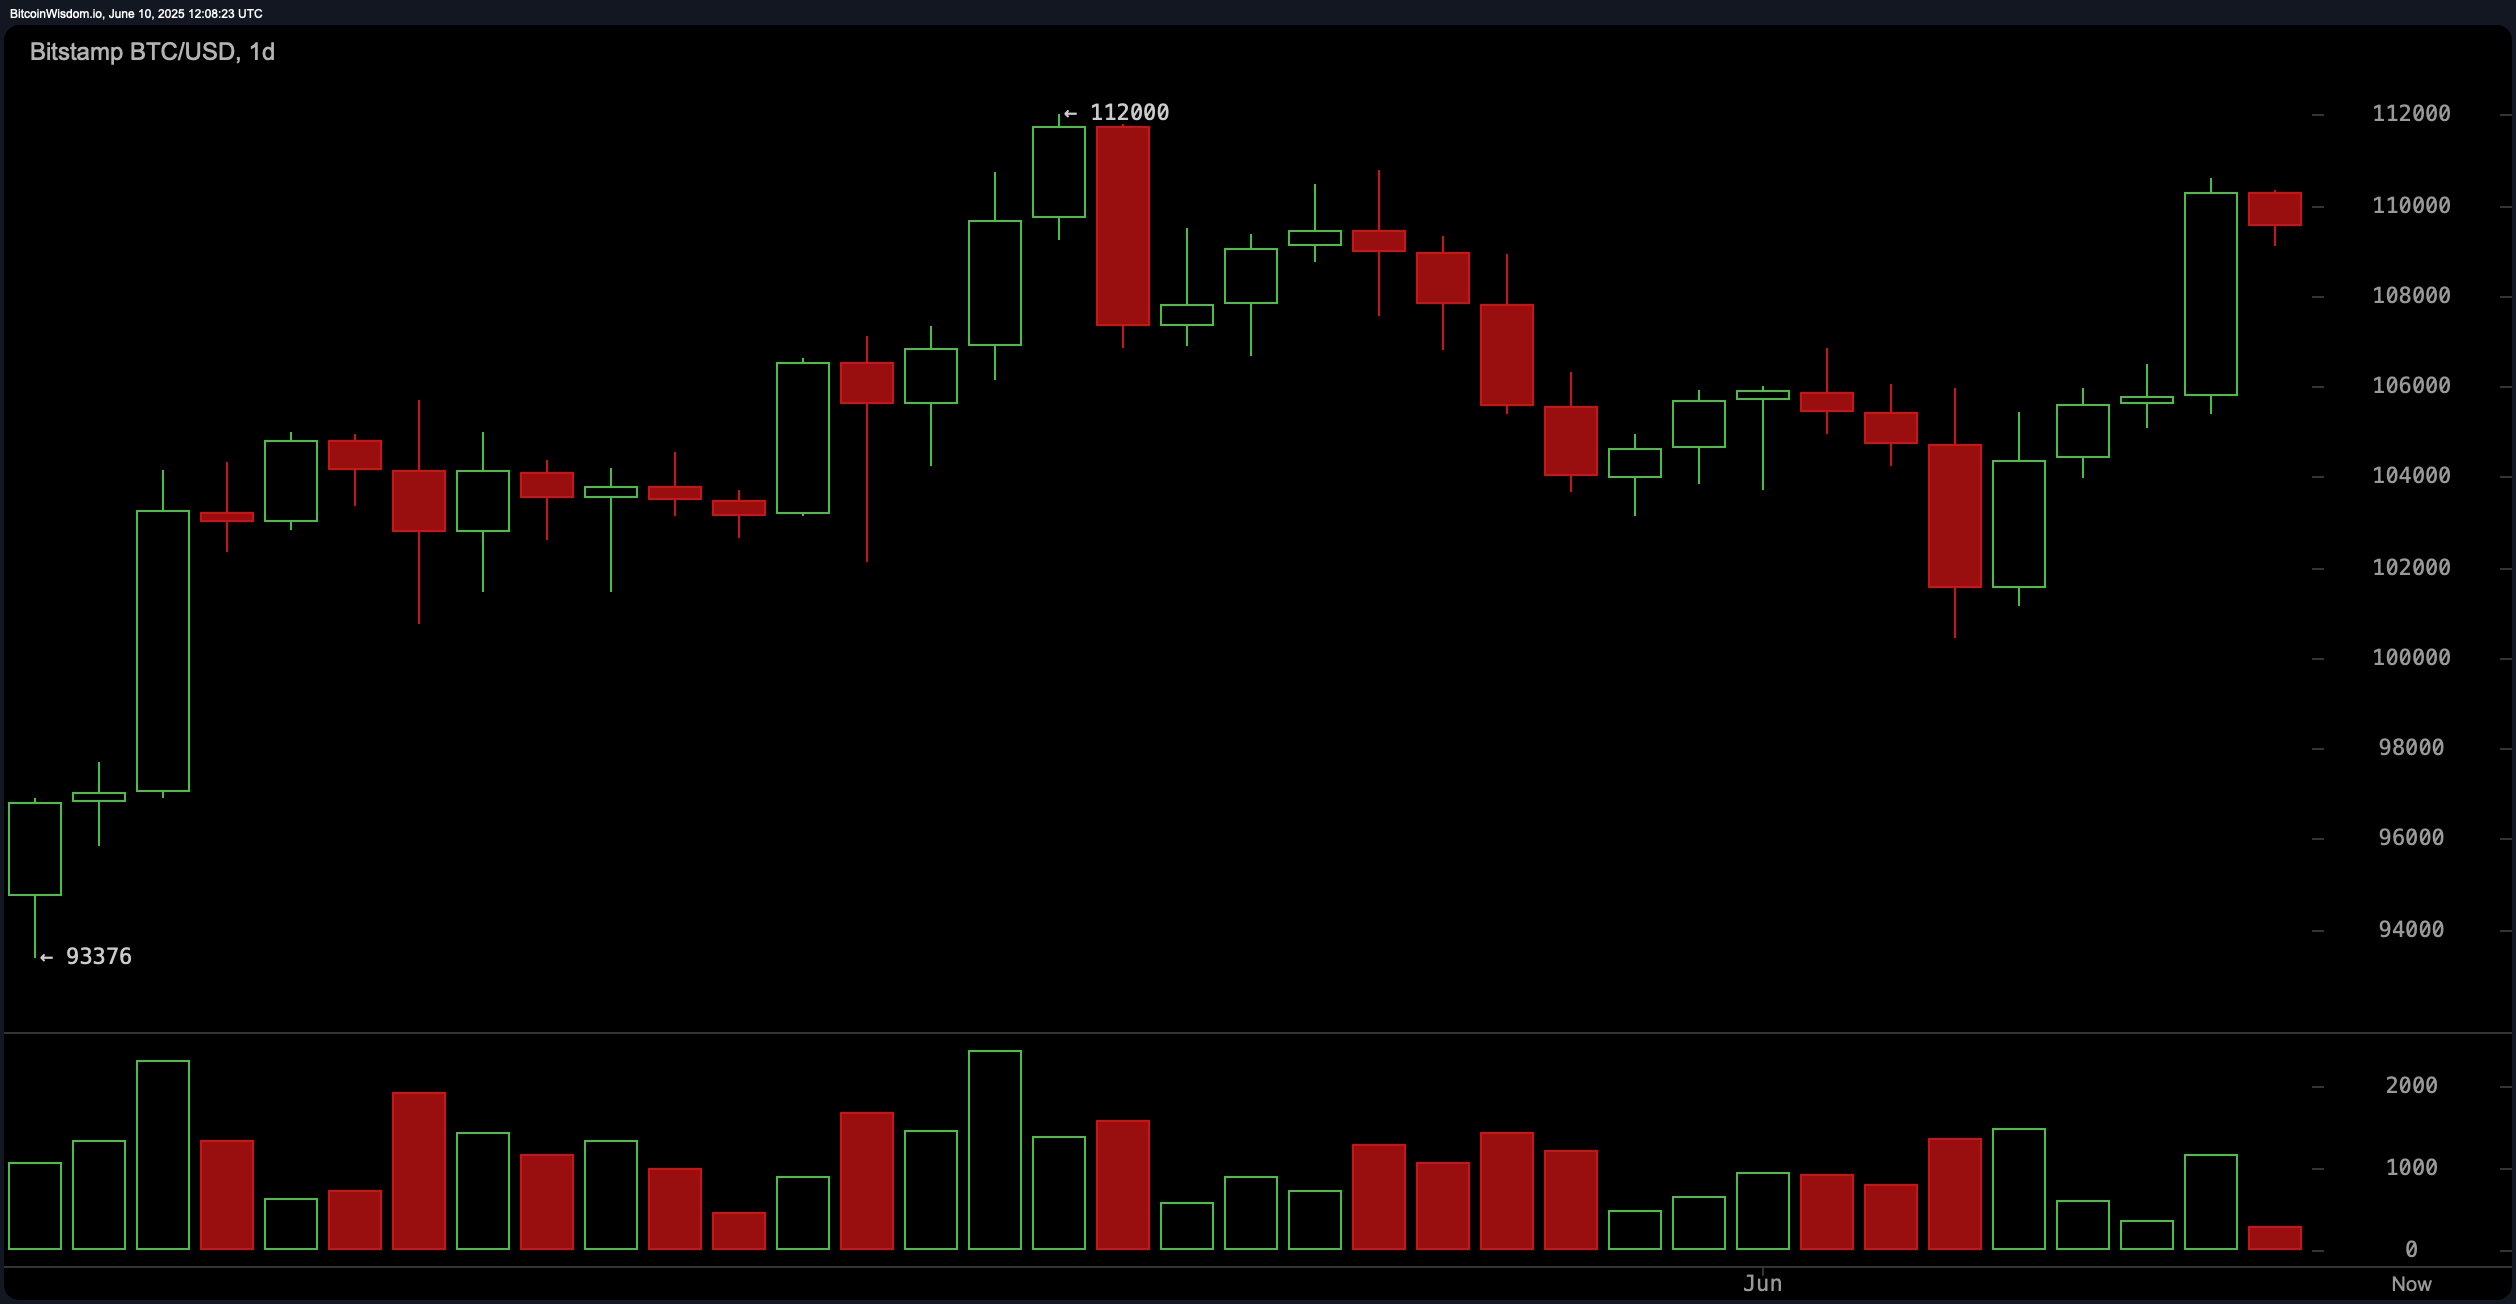
On the daily chart, bitcoin appears to be consolidating within a defined range of approximately $93,000 to $112,000. A strong upward move occurred around June 7, pushing the price to $112,000 before a sharp decline formed a bearish engulfing pattern. This suggests profit-taking or short-term selling pressure after the recent rally. The current consolidation phase around the $105,000–$110,000 zone indicates indecision among traders, with oscillators such as the relative strength index (RSI) at 61 and the Stochastic oscillator at 79 both signaling neutral conditions. However, the Awesome oscillator at 752 suggests underlying bullish momentum may still be present.
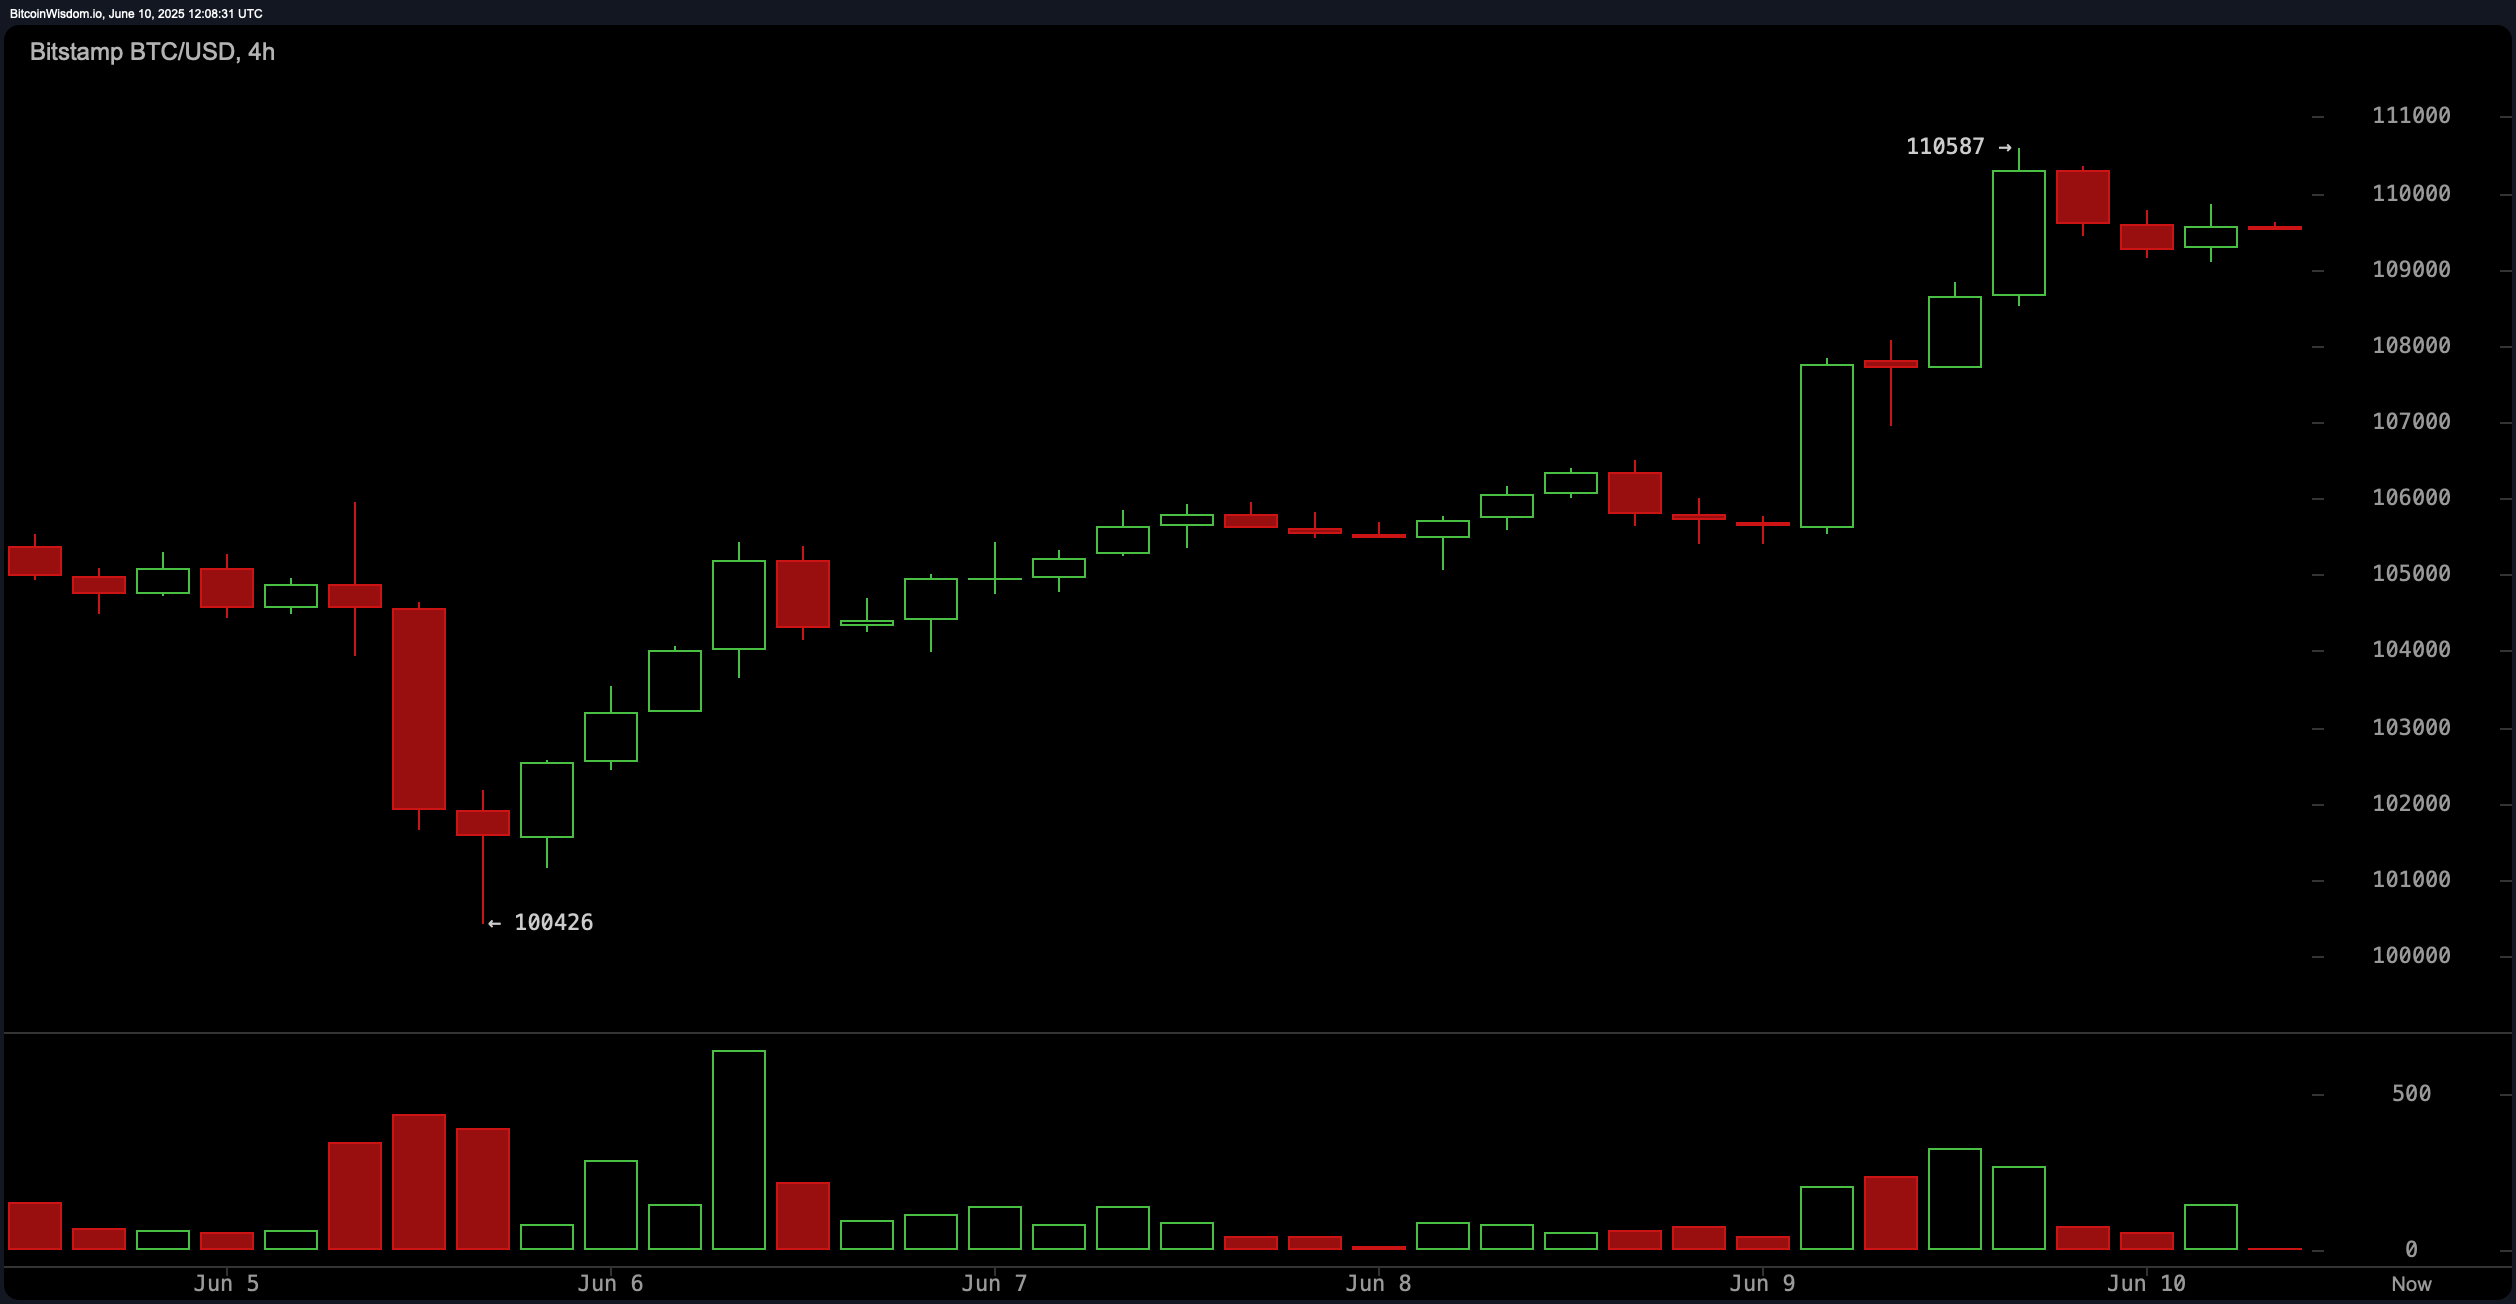
The 4-hour bitcoin chart reveals a more immediate consolidation following a rapid rally from $100,000 to $110,000. Volume has declined since reaching the peak of $110,587 on June 10, indicating reduced buying pressure and a potential pause in the uptrend. Technical indicators reflect this mixed sentiment: the commodity channel index (CCI) stands at 96, also in neutral territory, while the average directional index (ADX) at 19 shows a lack of trend strength. Moving averages across multiple timeframes—including the exponential moving average (EMA) and simple moving average (SMA)—are largely aligned to the upside, offering support for further bullish attempts if volume returns.
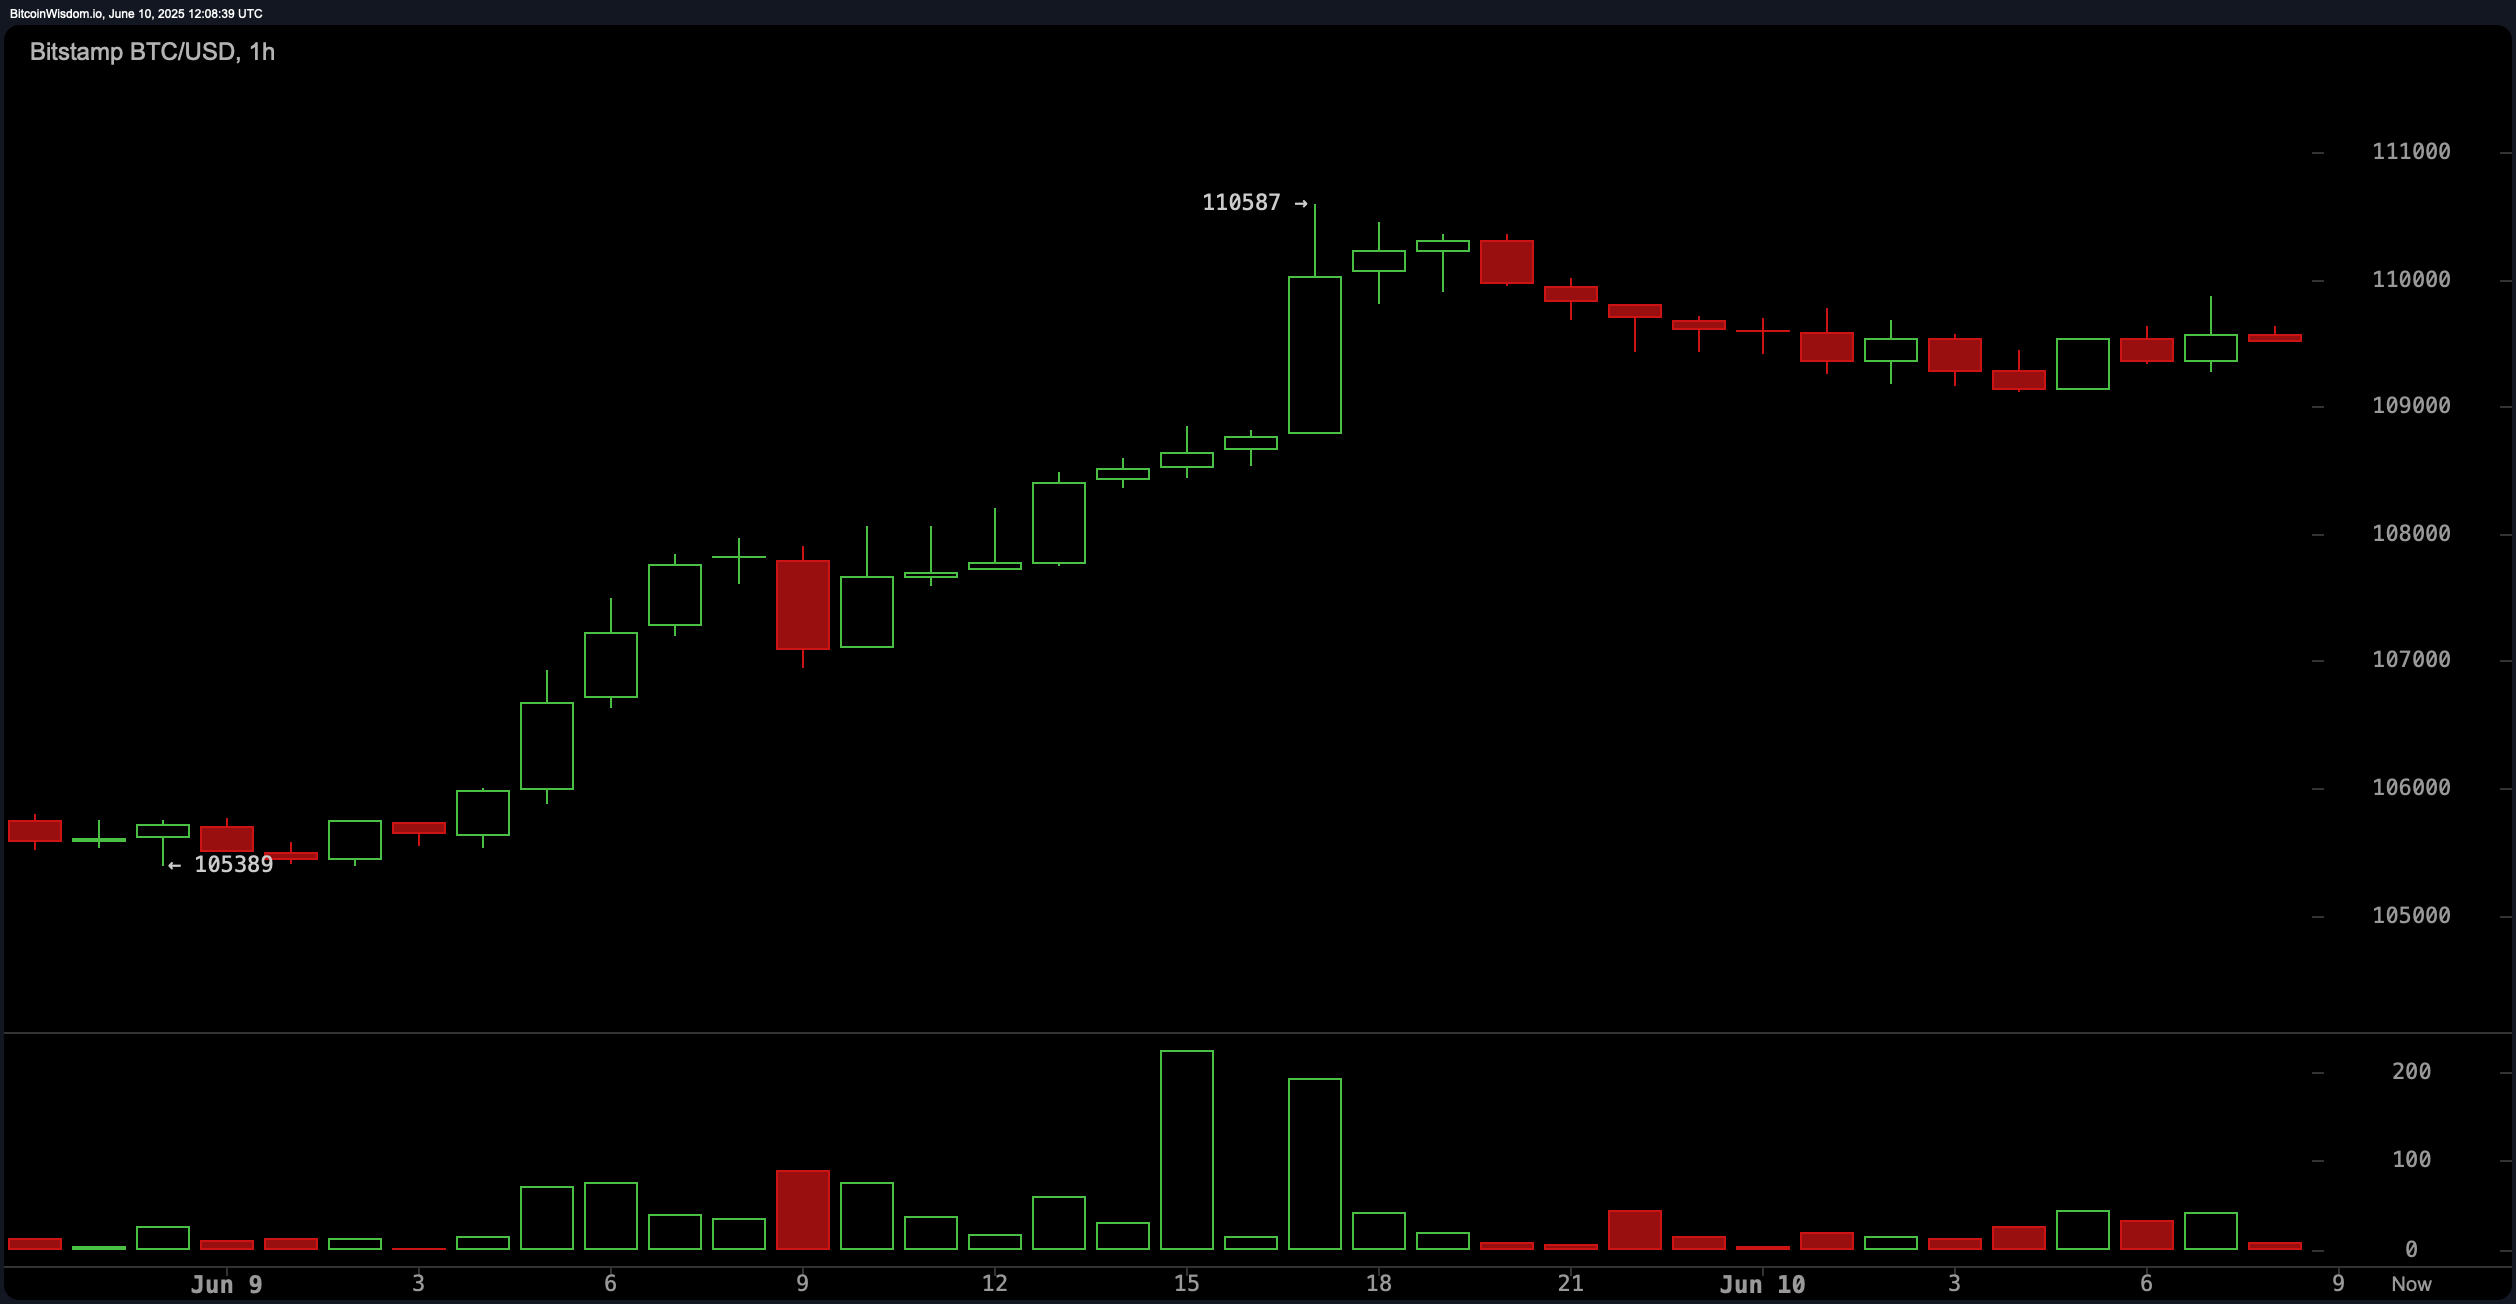
Zooming in on the 1-hour chart, bitcoin has been trading within a narrow band near $110,587, forming small-bodied candles that suggest hesitation among traders. The recent pullback after hitting the intraday high hints at minor profit-taking or resistance testing at psychological and technical levels. Momentum indicators are split, with the moving average convergence divergence (MACD) level at 1,315 signaling overbought conditions, while the awesome oscillator continues to print positive values. Volume bars have shrunk notably, reinforcing the idea that the market is awaiting a catalyst to determine the next directional move.
Looking at the broader technical landscape, all major moving averages—ranging from the EMA(10) at $106,758 to the SMA(200) at $95,420—are positioned below current price levels, reinforcing the bullish bias in the longer term. However, short-term traders should remain cautious as the market tests critical resistance zones.
A convincing break above $110,587 could open the door for a retest of the $112,000 level, while a drop below $108,000 might signal a deeper correction. Investors are advised to monitor volume trends and key technical thresholds closely as the cryptocurrency continues its consolidation phase.
Bull Verdict:
The technical indicators and moving averages strongly support a bullish bias, with all major simple and exponential moving averages positioned below current price levels. The awesome oscillator (752) is signaling buy pressure, and the price remains within a tight consolidation phase near key resistance levels. A breakout above $110,587 could pave the way for a retest of $112,000 and potentially higher valuations, making this a favorable setup for bulls who anticipate renewed momentum in the near term.
Bear Verdict:
Despite the bullish alignment of moving averages, warning signs are emerging across oscillators that suggest overbought conditions and potential exhaustion. The moving average convergence divergence (MACD) level at 1,315 and momentum indicator at 4,962 both signal sell pressure, while volume has notably declined during the recent consolidation. Additionally, the bearish engulfing pattern on the daily chart and repeated failure to sustain above $112,000 indicate strong selling interest at higher levels. Bears may look for a confirmed break below $108,000 to initiate short positions with targets toward $104,000 or lower.