
Bitcoin traded at $85,287 on Saturday, commanding a $1.69 trillion market capitalization while moving $10.68 billion across exchanges in 24 hours. During the session, the leading cryptocurrency by market cap roamed between $84,366 and $85,398, packing price tension into a narrow corridor that could ignite the next decisive break.
Bitcoin
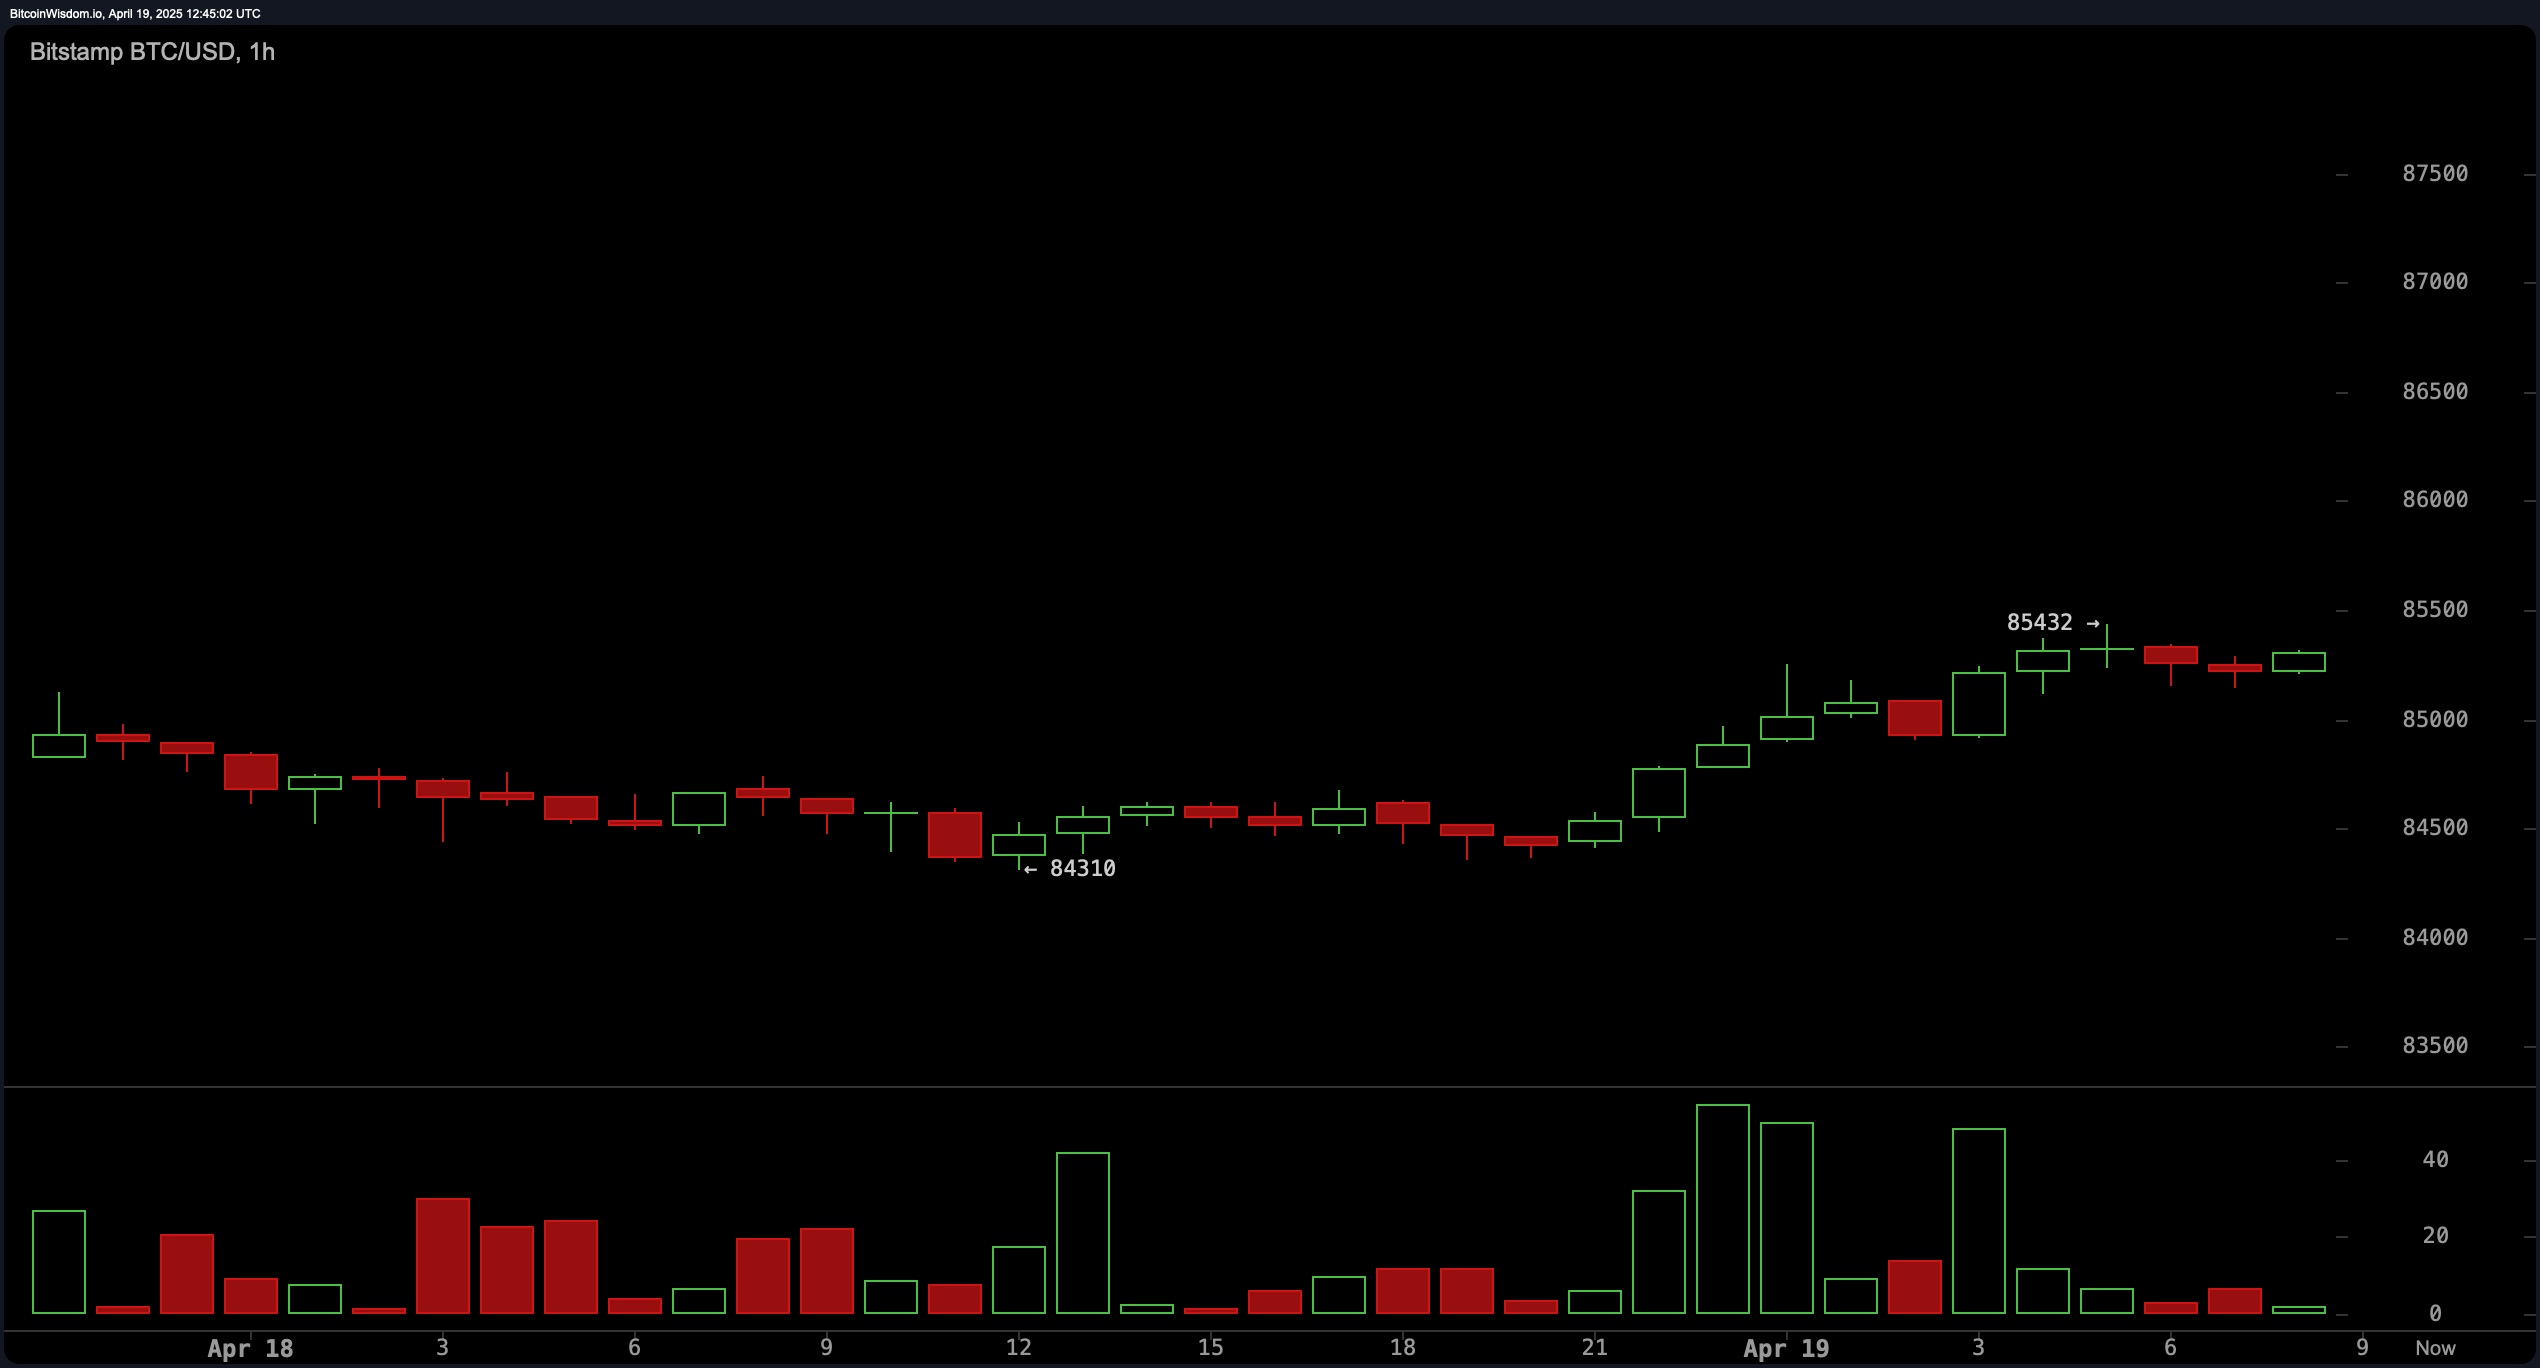
On the 1‑hour chart, bitcoin‘s price action carved a brisk climb from $84,310 to $85,432 before easing into a brief consolidation just above the 61.8% Fibonacci retracement at $84,739. Market depth showed bids thickening near that golden‑ratio level, and short‑term momentum cooled without collapsing—hinting that traders may reload longs if bitcoin retests the $84,700–$84,900 pocket with light sell volume. A decisive hourly close above $85,400 would quicken a push toward the week’s $86,000 liquidity node, whereas a slip under $84,300 would invite probes of deeper support.
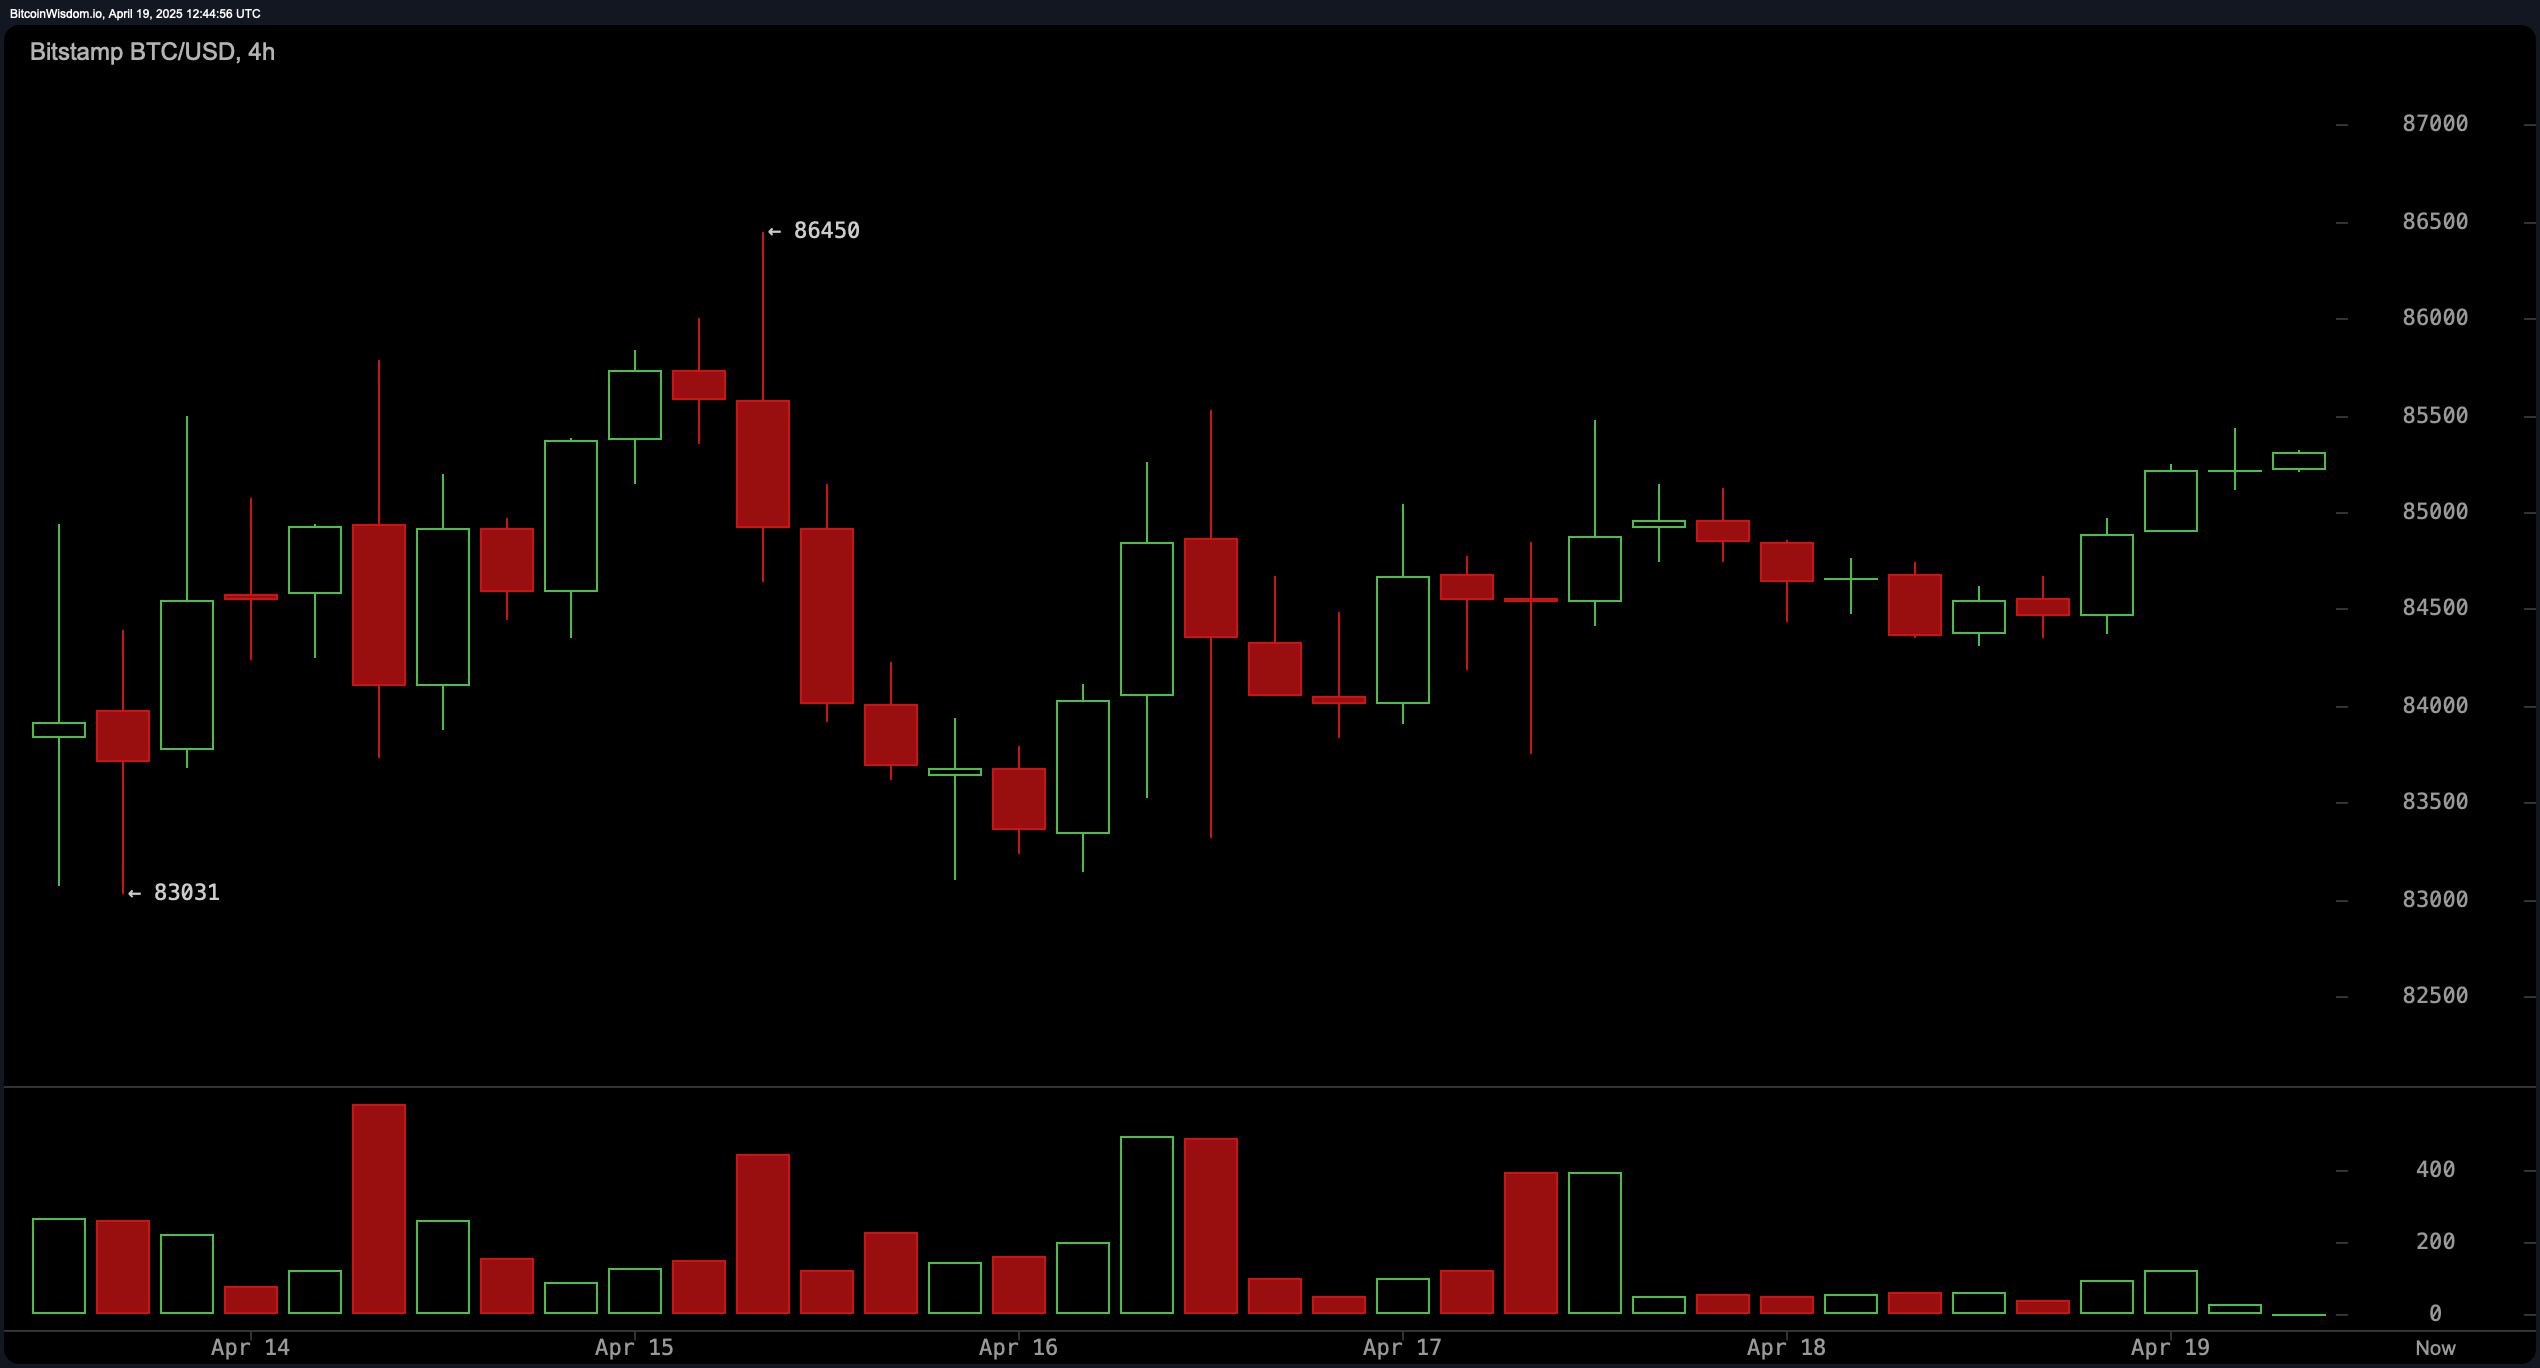
Zooming out to the 4‑hour timeframe, bitcoin has tracked a modest series of higher lows since bouncing off $83,031, while sellers cap advances near $86,450. This sideways‑to‑up channel suggests accumulation rather than exhaustion. Volume surges accompany both rallies and pullbacks, indicating balanced two‑way interest. A sustained hold above the midpoint at $85,000 shifts the bias toward testing the upper boundary, with a clean breakout projecting to the late‑March swing high around $88,000. Failure to defend $83,000, however, would likely drag price toward the $80,000 psychological shelf traders watched last month.
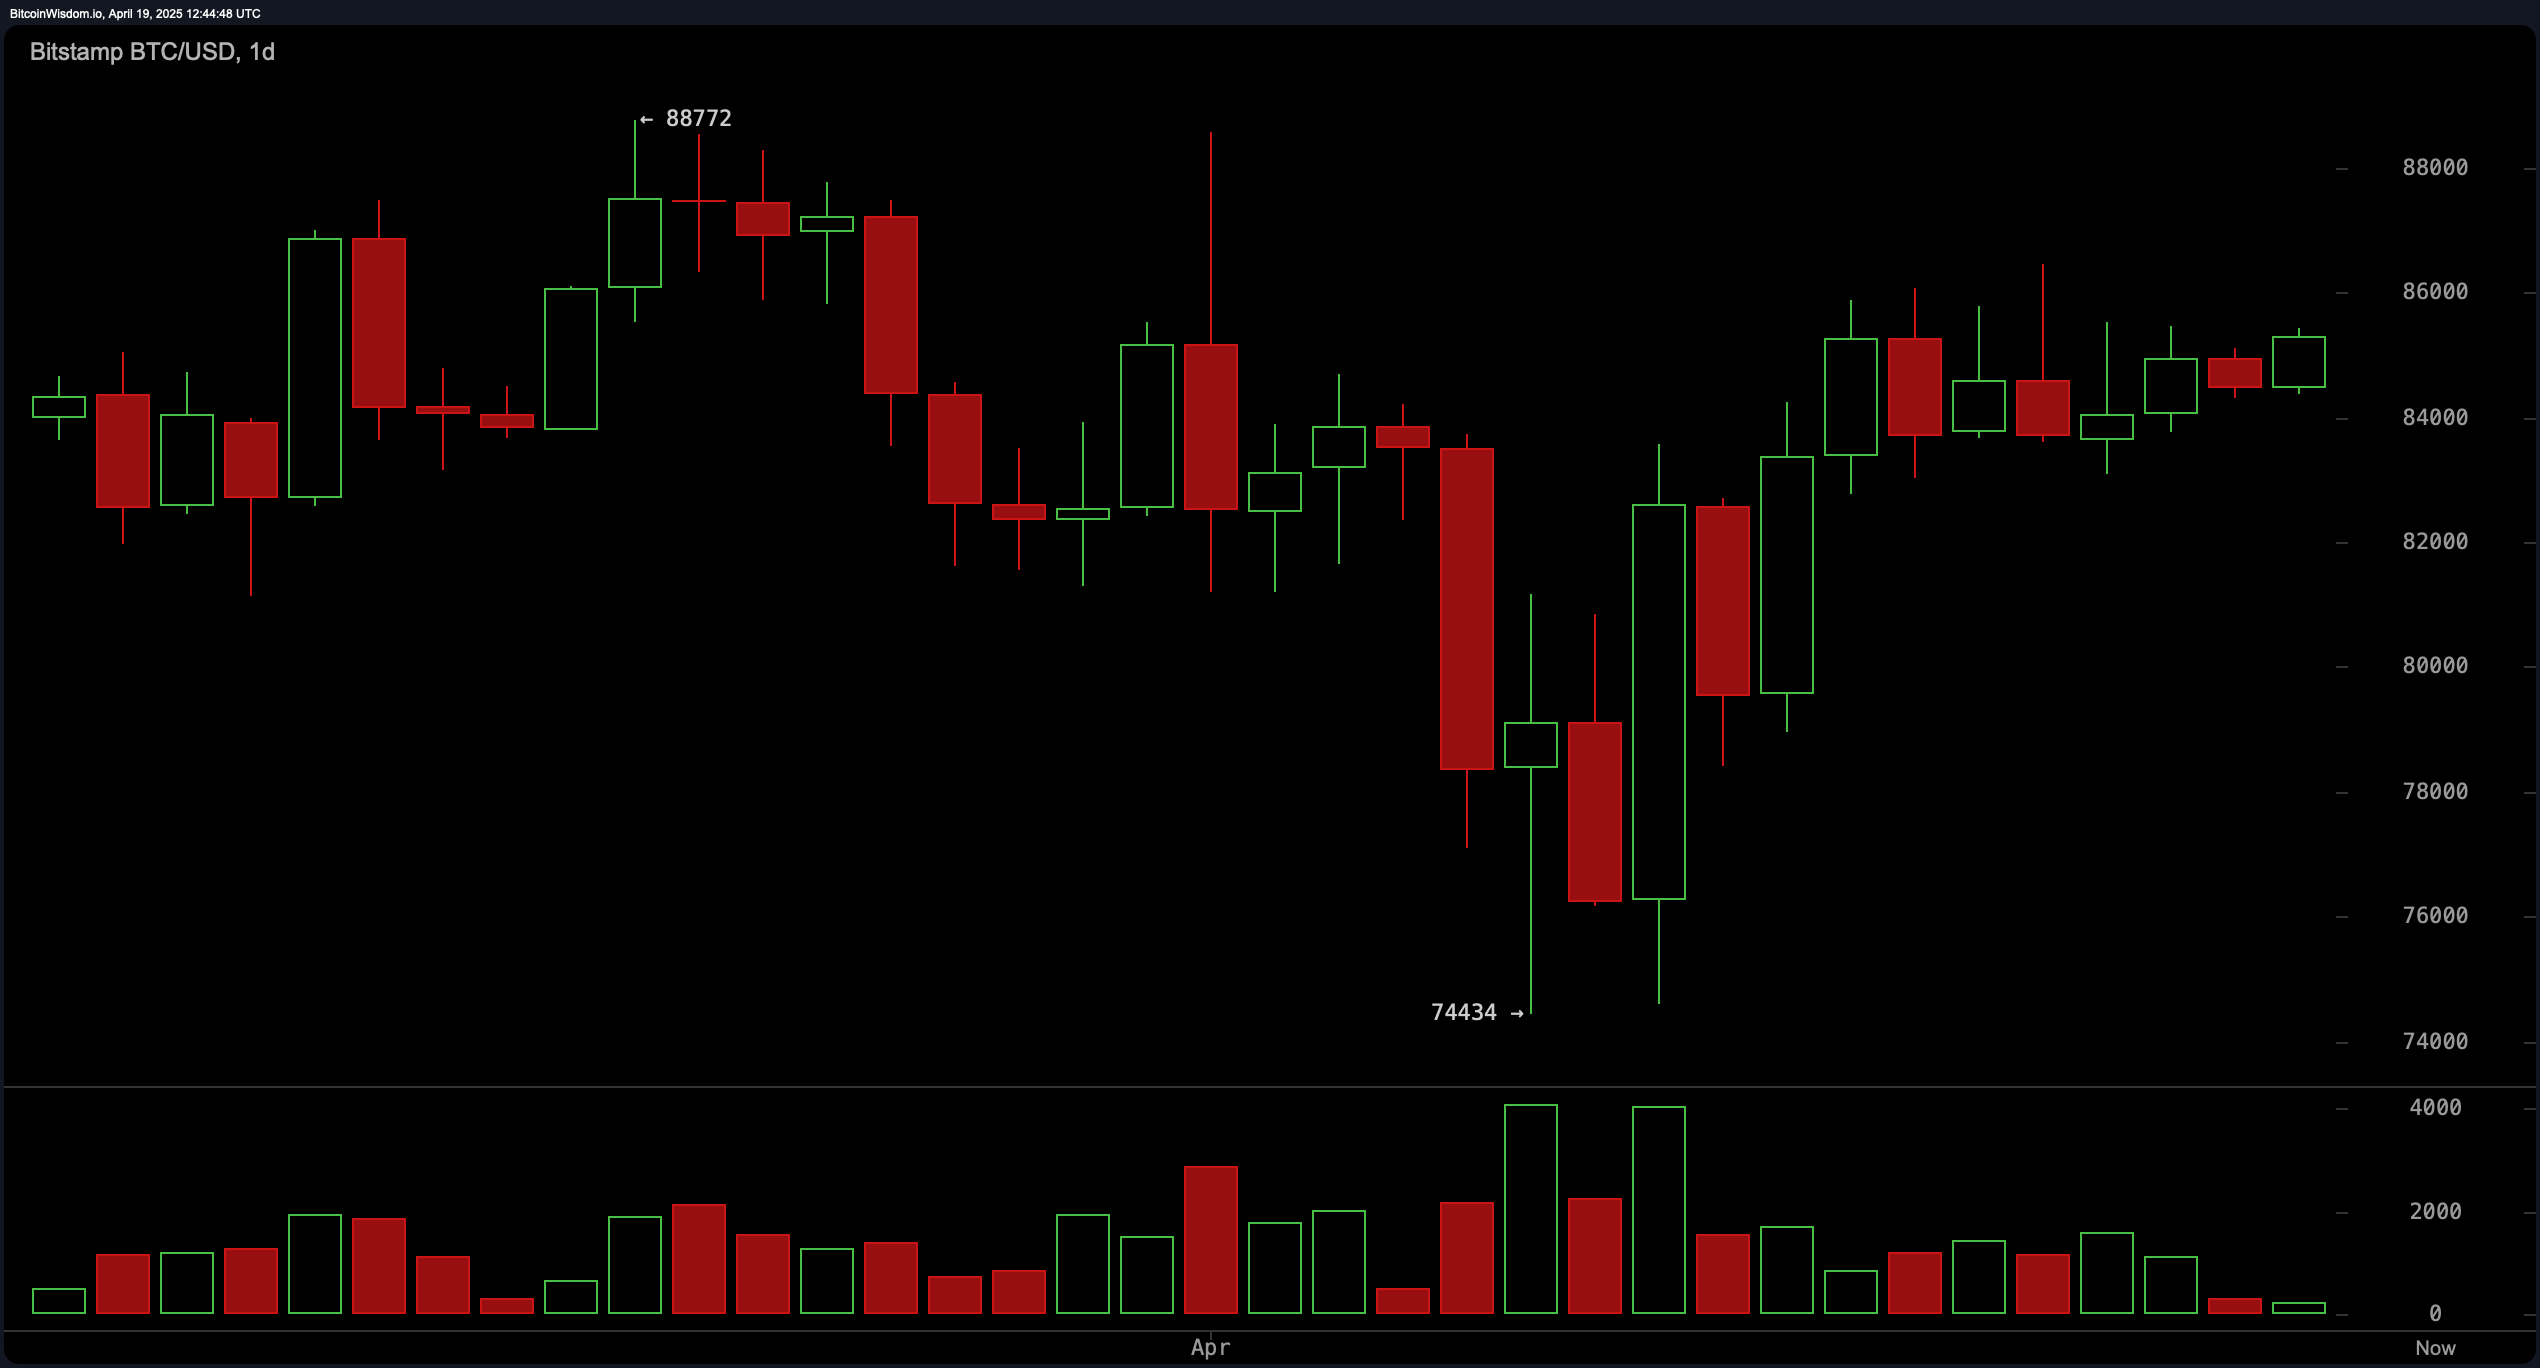
The daily chart paints a broader recovery narrative after April’s retreat to $74,434. Bitcoin has since reclaimed more than half that drawdown and now flirts with the 23.6% retracement at $85,388—an area that often decides whether relief rallies mature into fresh impulsive advances. The bullish engulfing candle posted near the low underscored strong dip demand, and follow‑through buying has kept the market on pace to revisit the $88,772 yearly peak. Still, traders will eye $81,603, the 50% daily retracement, as critical support should macro headwinds appear.
Oscillator readings largely echo equilibrium. The relative strength index (RSI) sits at 53, the Stochastic oscillator at 87, the commodity channel index (CCI) at 81, the average directional index (ADX) at 13, and the Awesome oscillator at 1,045—all signaling neutrality rather than trend exhaustion. Momentum (MOM) at 2,720 flashes a sell bias, implying waning upside speed, while the moving average convergence divergence (MACD) prints a positive 45, tilting slightly bullish. The mixed tableau counsels patience: traders can wait for either MOM to revert or MACD to fade before adopting a high‑conviction stance.
Moving‑average (MA) gauges lean constructive but not unequivocal. Short‑term exponential moving averages (EMA 10 / 20 / 30) and simple moving averages (SMA 10 / 20 / 30) cluster between $82,799 and $83,973, each flashing optimism and providing a cushion beneath spot price. The EMA 50 at $85,327 issues a bearish signal, hinting that bitcoin must clear that hurdle decisively to unlock space toward $88,000, while the SMA 50 at $84,221 offers intermediate support. Higher‑frame signals conflict: the EMA 100 and SMA 100, sitting at $87,414 and $91,061, remain in bearish territory, yet the EMA 200 at $85,008 switches back to the bullish range. Traders should thus track any crossovers between the EMA 50 and EMA 200 for early trend confirmation.
Fibonacci retracement grids across the three timeframes converge into two zones of tactical interest. On the micro side, overlapping 50 – 61.8% bands on the 1‑hour and 4‑hour charts frame $84,337 to $84,871—a likely reload region for dip buyers. On the macro canvas, the daily 50% mark at $81,603 aligns with the psychologically potent $80,000 handle and the 61.8% level at $79,911, mapping an attractive swing‑entry basin if a deeper pullback materializes. Conversely, conquering the daily 23.6% line at $85,388 would open a technical glide path toward $88,772, the last resistance before uncharted territory.
Bull Verdict:
If bitcoin defends the $84,300–$85,000 cushion and secures a clear hourly close above $85,400, upside momentum could carry the price toward the $88,000 swing high and potentially new territory beyond.
Bear Verdict:
A decisive break below $83,000 would tip the balance to sellers, inviting a drift to the 50 percent daily retracement at $81,603 and perhaps the 61.8 percent level near $79,900, with $74,434 waiting as the last major support.