Bitcoin’s price has been scaring off a lot of newcomers with choppy movements, which add to the overall uncertainty.
Yet, things might not be over for the asset’s bull run, as another rally could be bound to happen soon.
Technical Analysis
By Edris Derakhshi (TradingRage)
The Daily Chart
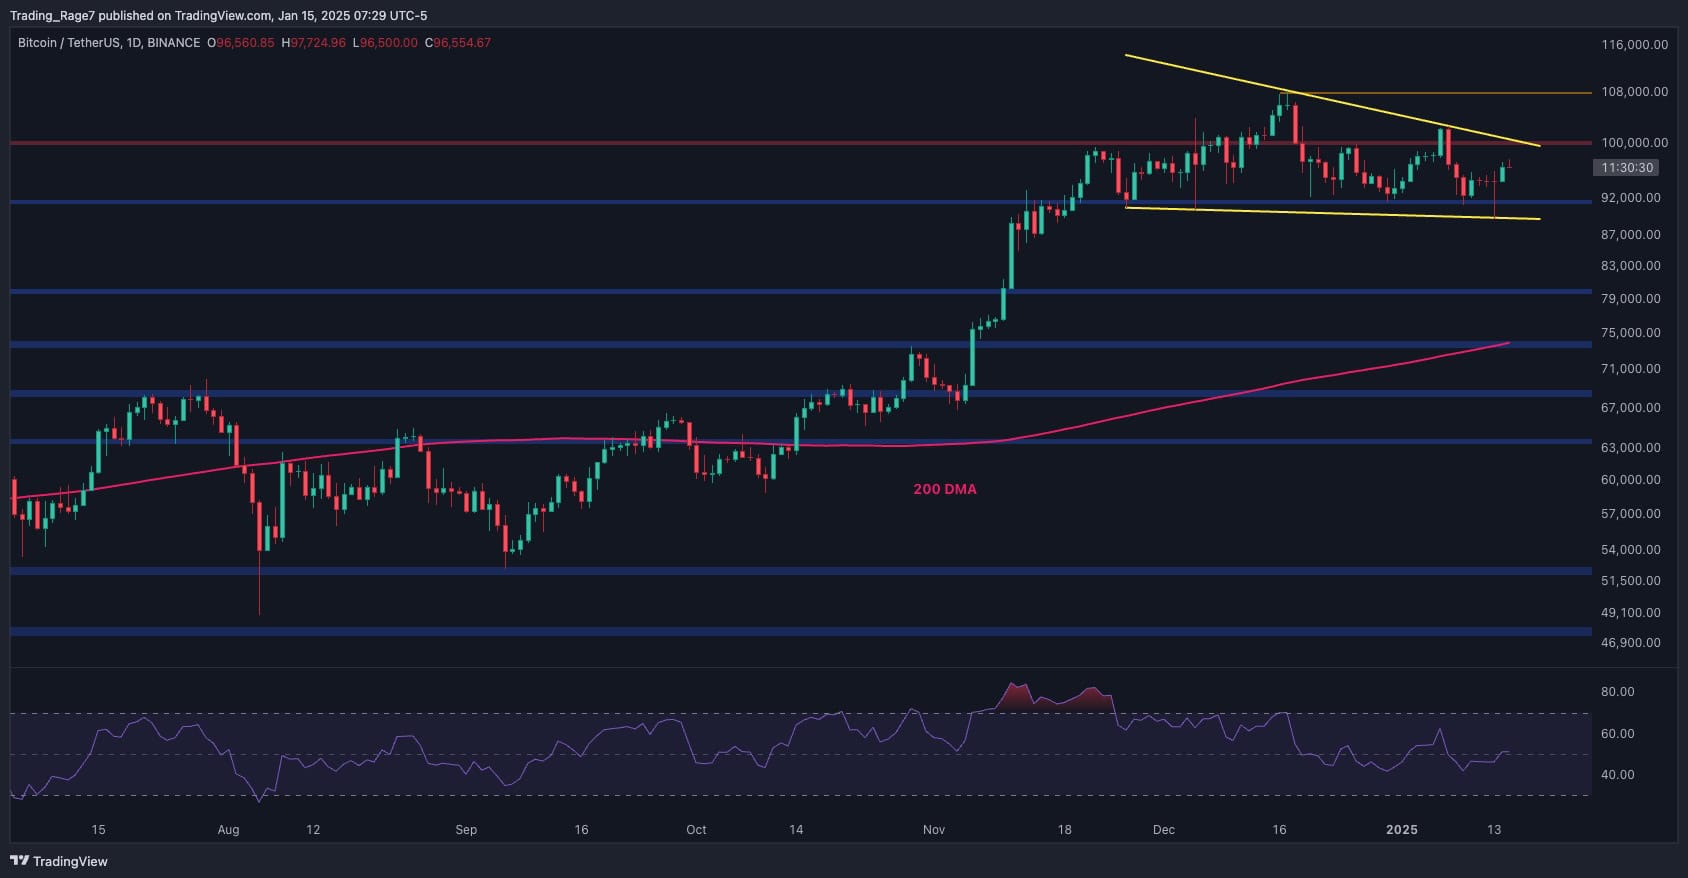
On the daily chart, the cryptocurrency has been consolidating below the critical $100K level after briefly rising above it twice. A large falling wedge pattern is forming at the moment, which has the market trapped inside.
If the price is able to break the pattern to the upside with momentum, an aggressive rally will likely occur in the coming months, which could even see BTC touch the $120K mark.
The 4-Hour Chart
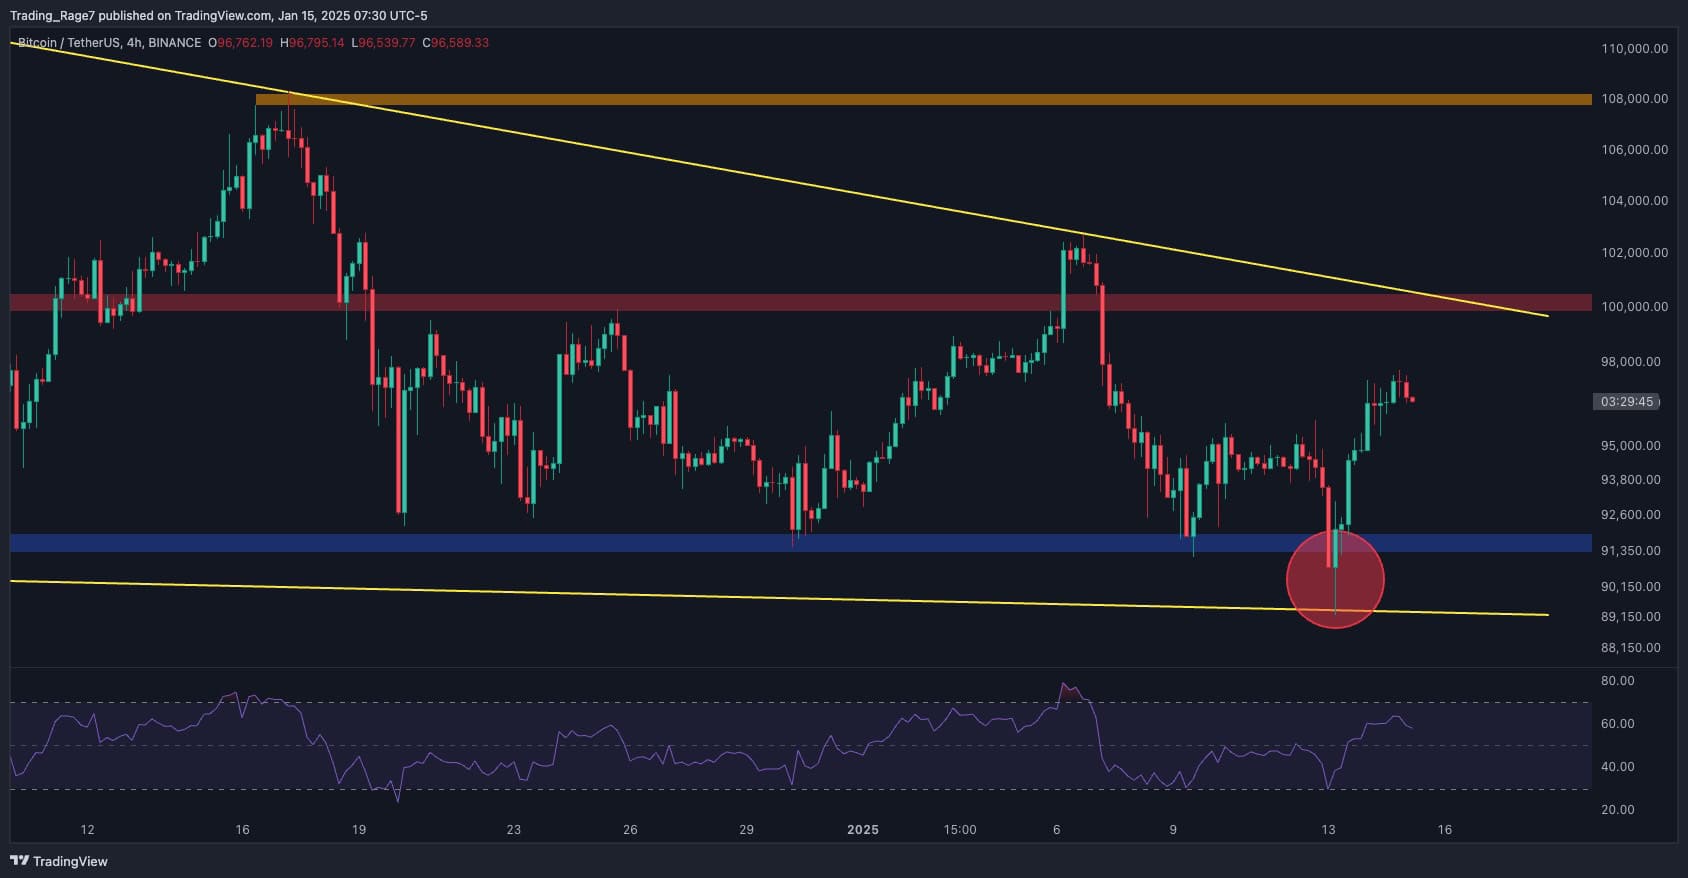
On the 4-hour timeframe, things look a lot more interesting, as Bitcoin is showing early signs of a new bullish phase.
The market has hunted the stop losses of many traders when it briefly dropped below the $90K area and has rapidly rebounded. This is a typical reversal pattern, with the price also breaking the recent high and creating a higher one. As a result, a rally at least toward the $100K level could be expected soon.
Sentiment Analysis
By Edris Derakhshi (TradingRage)
Bitcoin Taker Buy Sell Ratio
With Bitcoin demonstrating rangebound price action, investors are wondering what is preventing the market from continuing its rally higher. Analyzing the futures market metrics yields a probable answer.
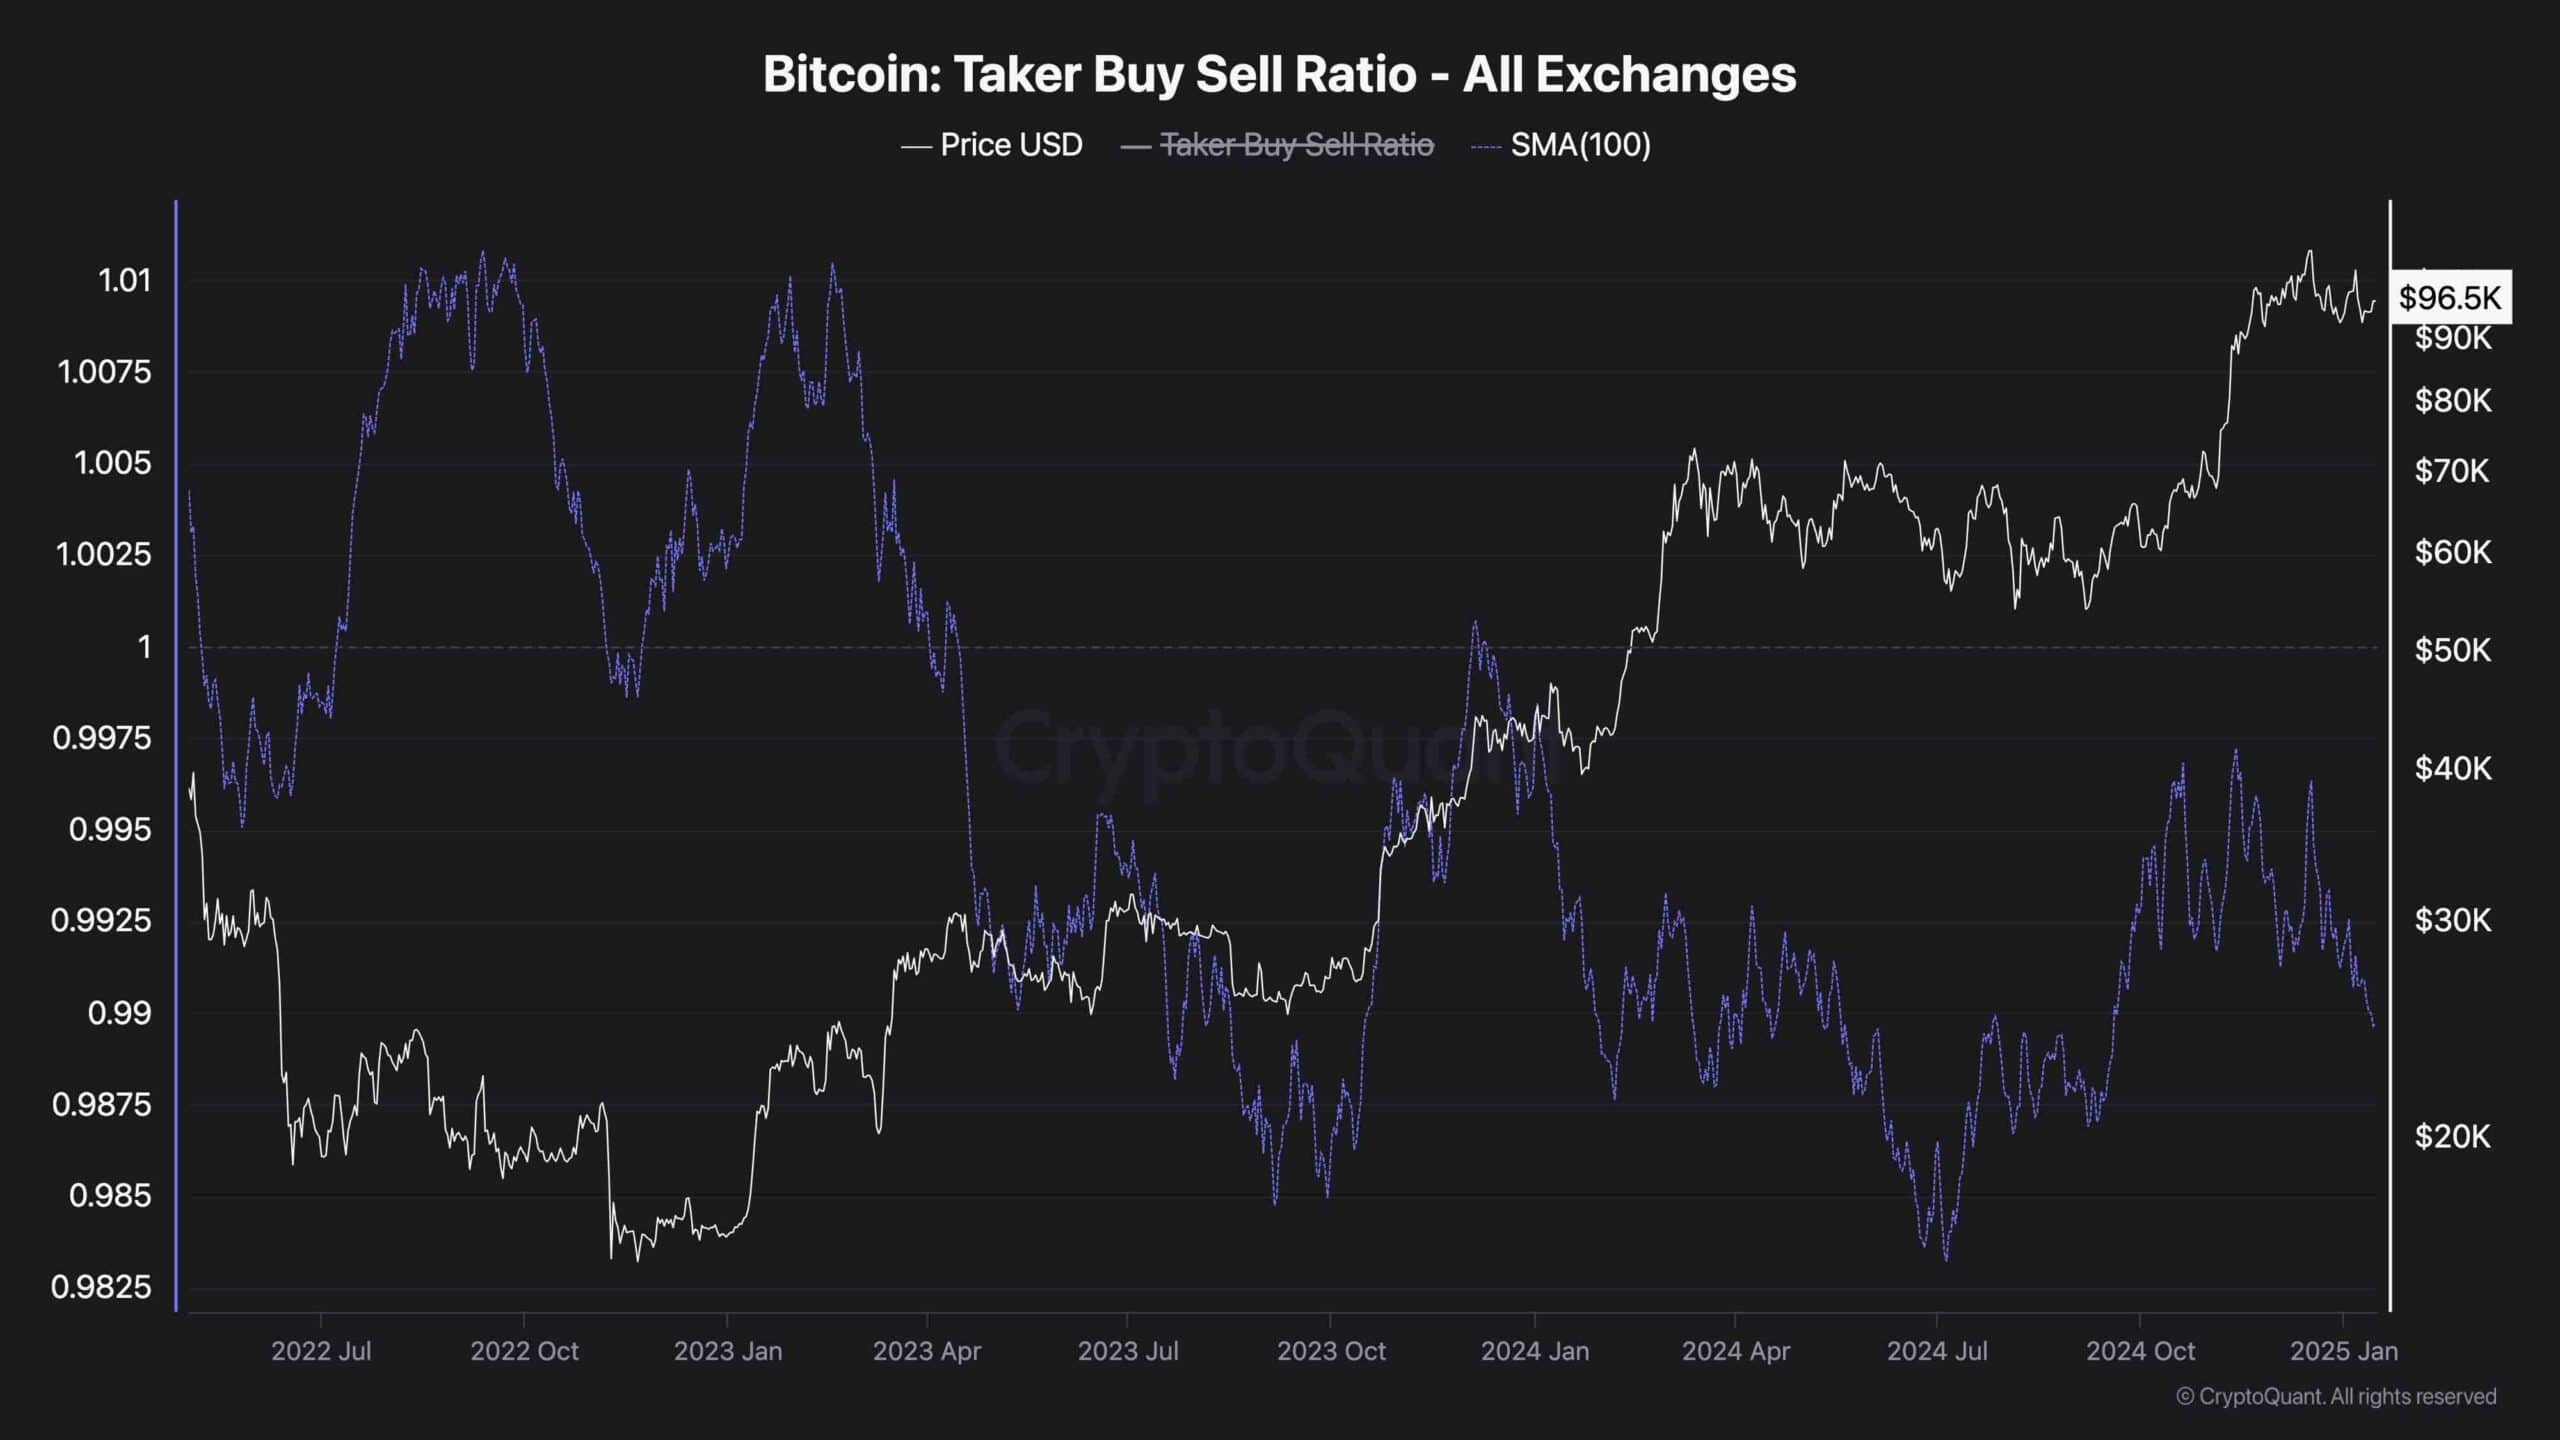
This chart presents the Bitcoin taker buy-sell ratio, which measures whether the buyers or the sellers are executing their positions more aggressively in the futures market. Aggressive orders are those executed at the market.
As the chart shows, the 100-day moving average of this metric has recently experienced a downturn after months of trending higher. This means that the sellers are once again the dominant force in the futures market and have likely caused the current halt in Bitcoin’s bullish run.
