
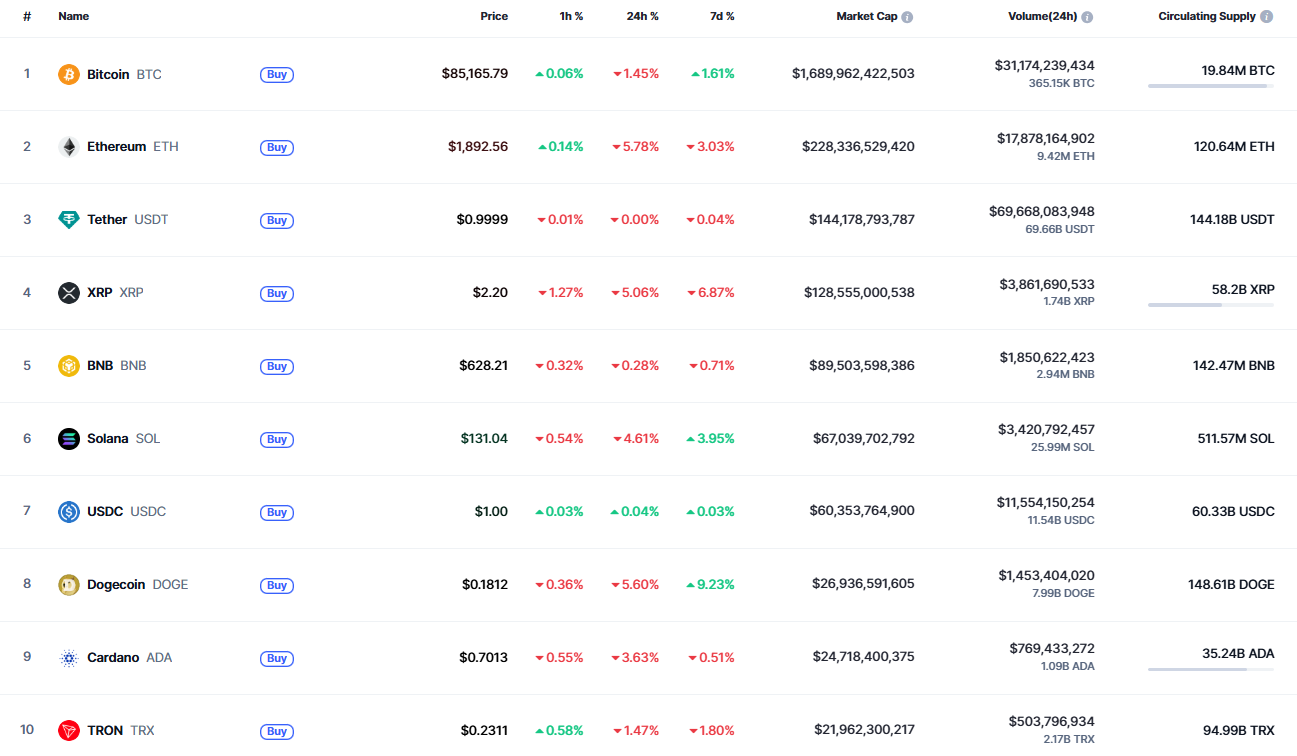
Sellers are back in the game as most of the coins are in the red zone, according to CoinMarketCap.
BTC/USD
The price of Bitcoin (BTC) has dropped by 1.45% over the last 24 hours.
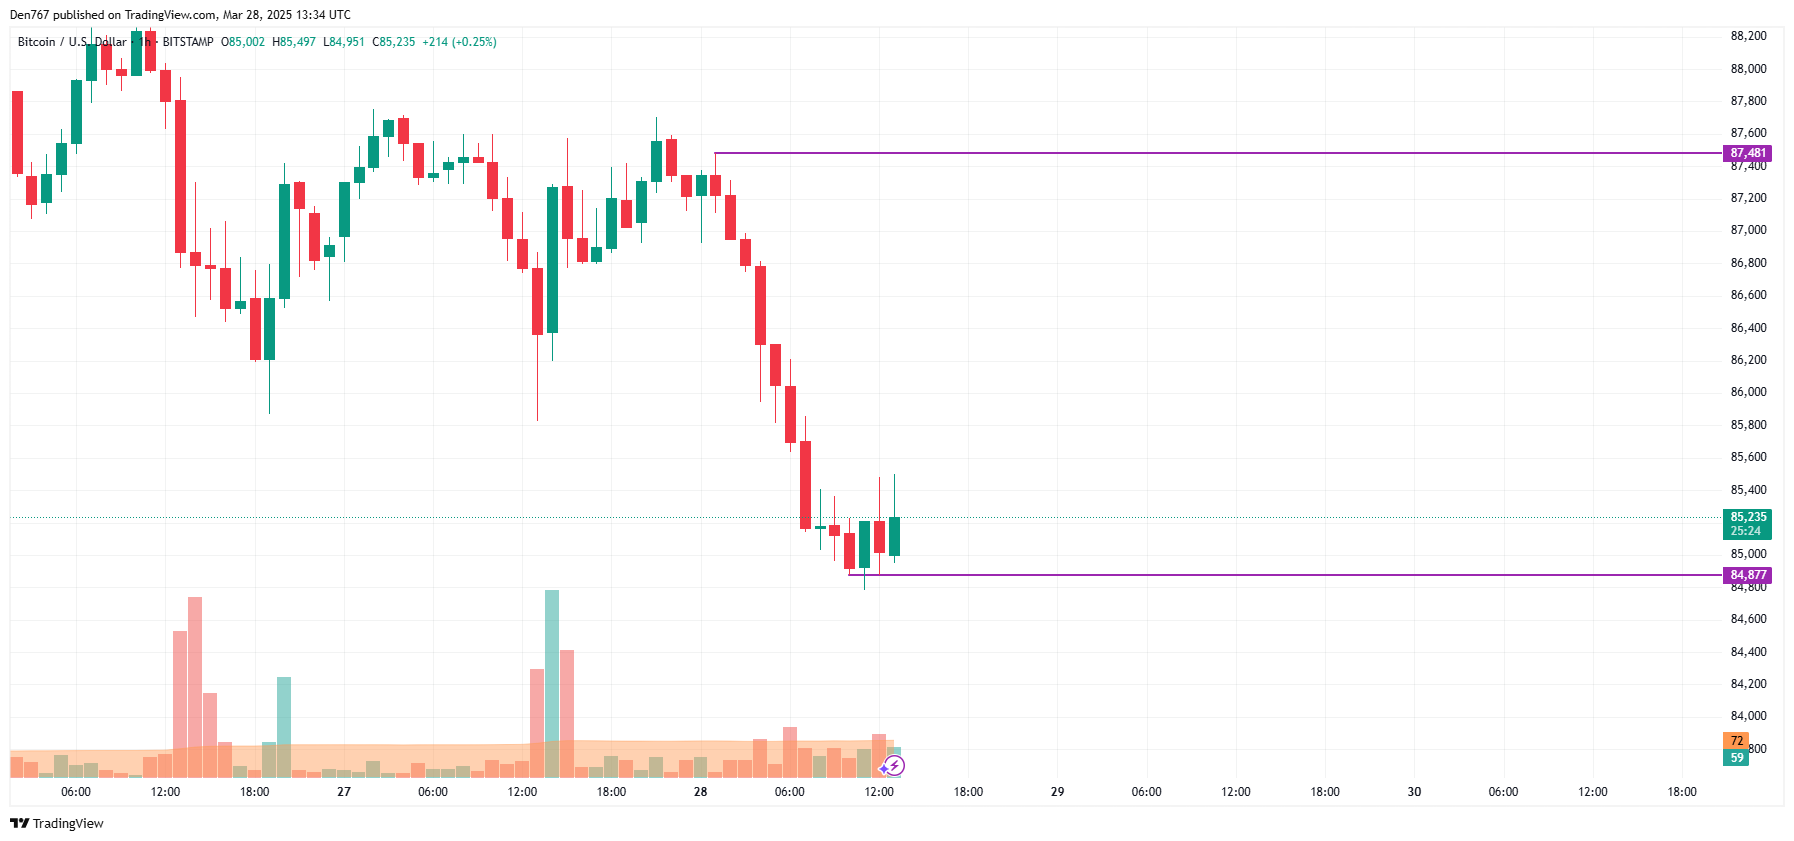
On the hourly chart, the rate of BTC is near the local support of $84,877. If a bounce back does not happen by the end of the day, one can expect a level breakout, followed by a dump to the $84,000 zone.
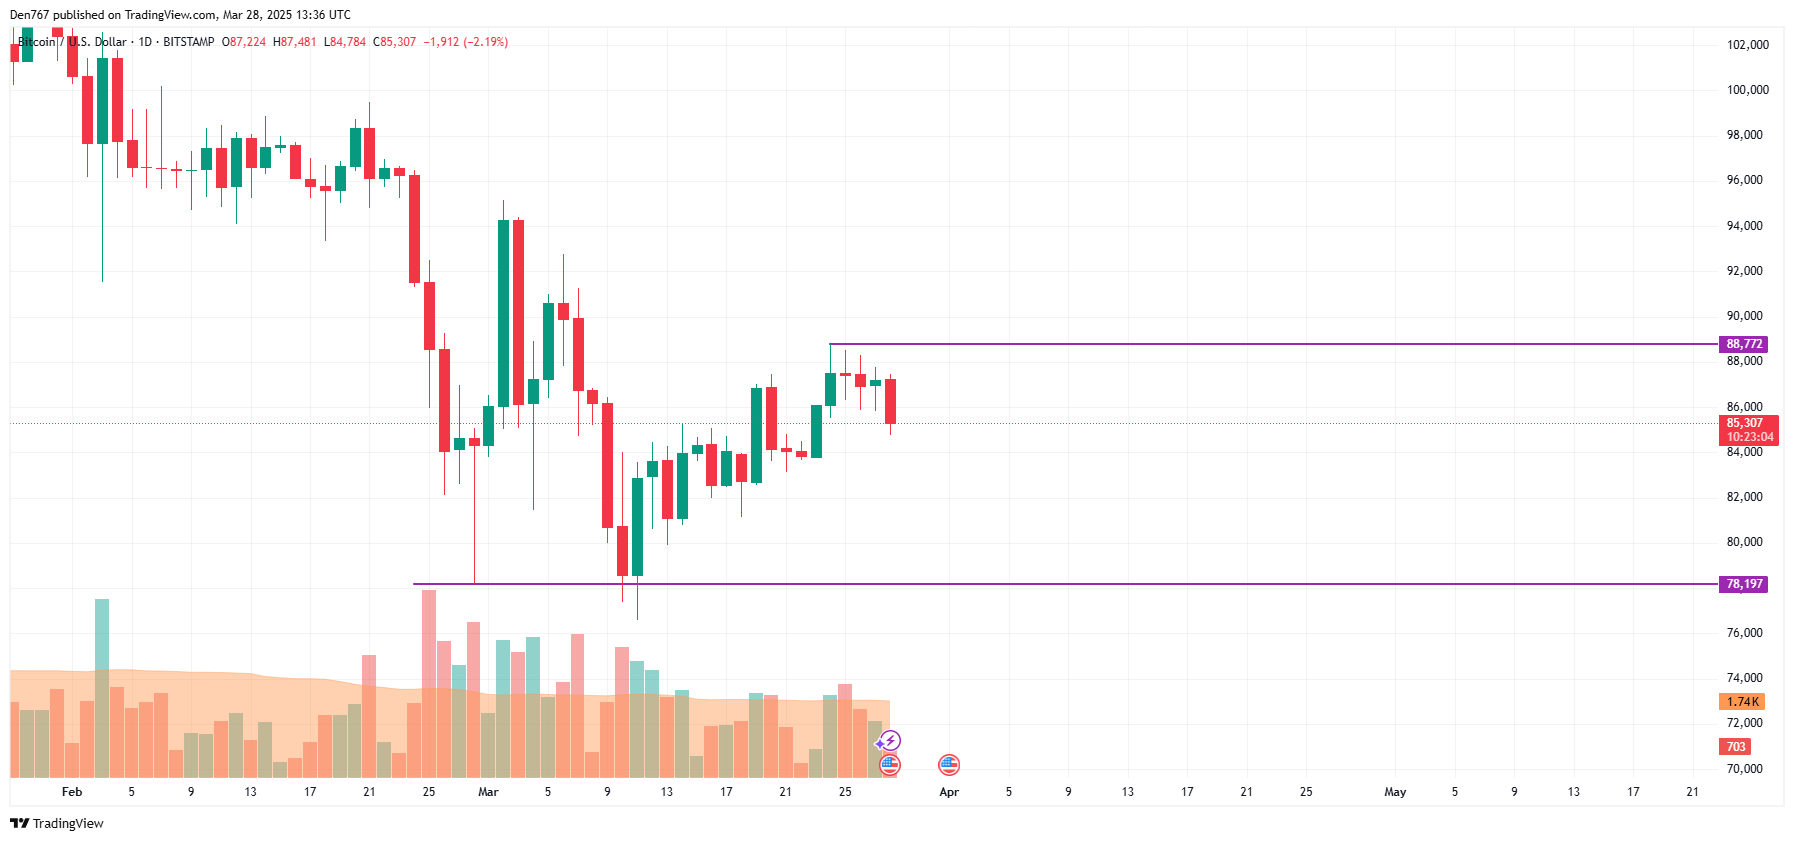
On the daily time frame, there are no reversal signals yet. If the candle closes near $86,000, traders may witness a test of the $82,000-$83,000 zone by the end of the week.
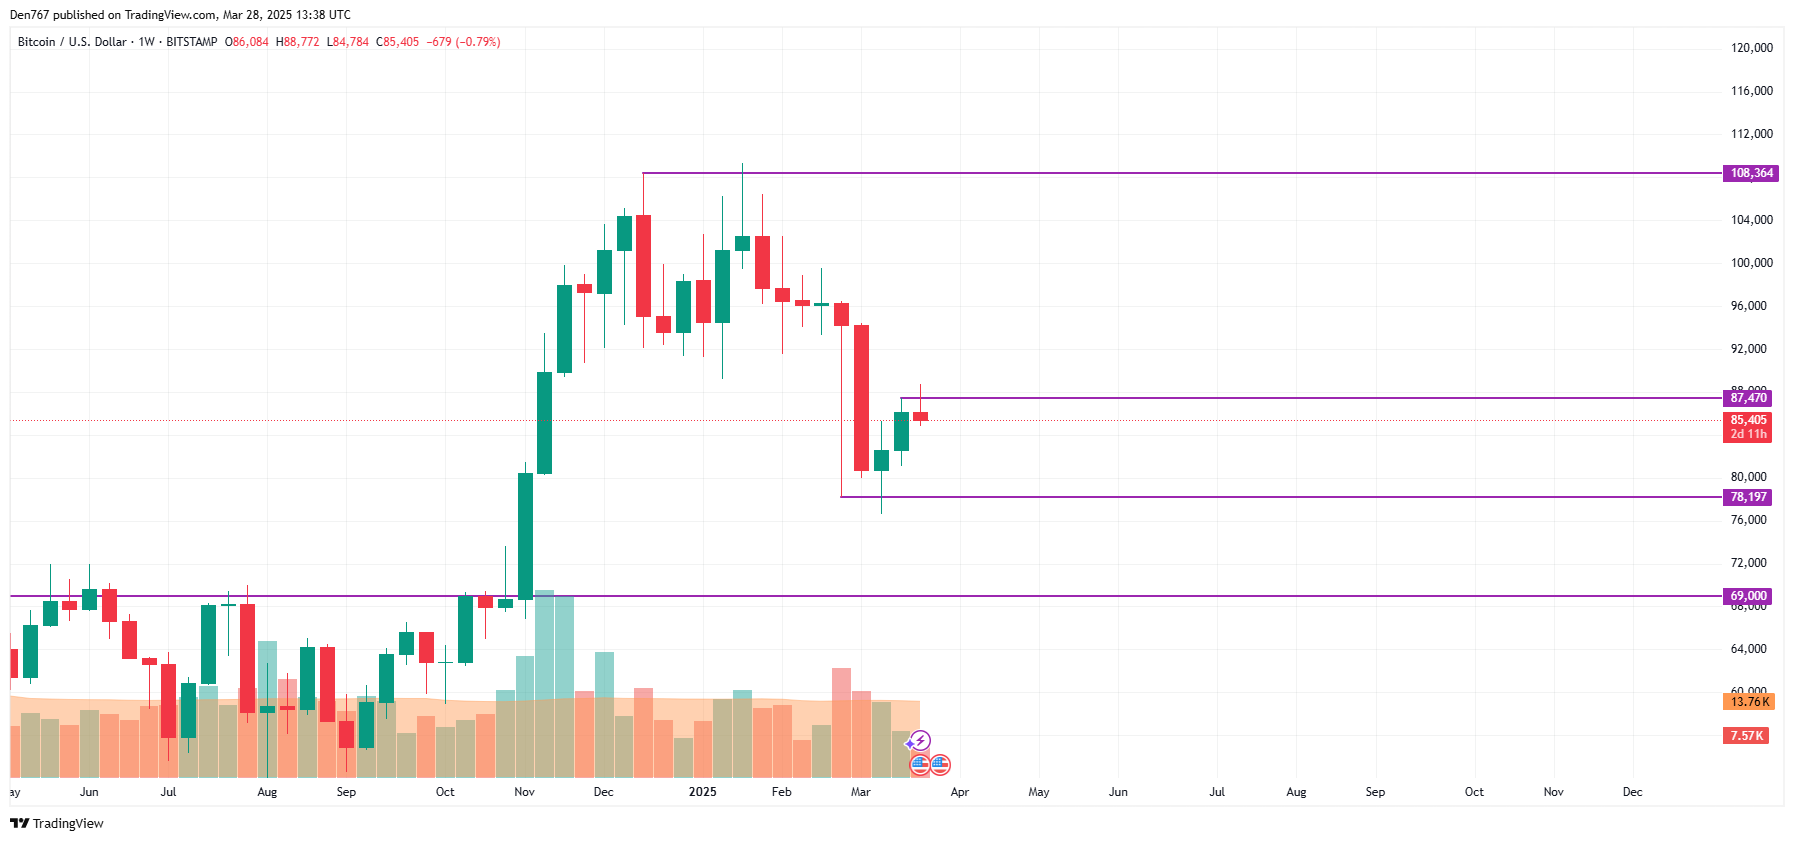
From the midterm point of view, the rate of BTC has made a false breakout of the previous bar\'s high. If the weekly candle closes far from it, one can expect an ongoing decline to the $80,000 mark.
Such a scenario is relevant until the end of the month.
Bitcoin is trading at $85,530 at press time.