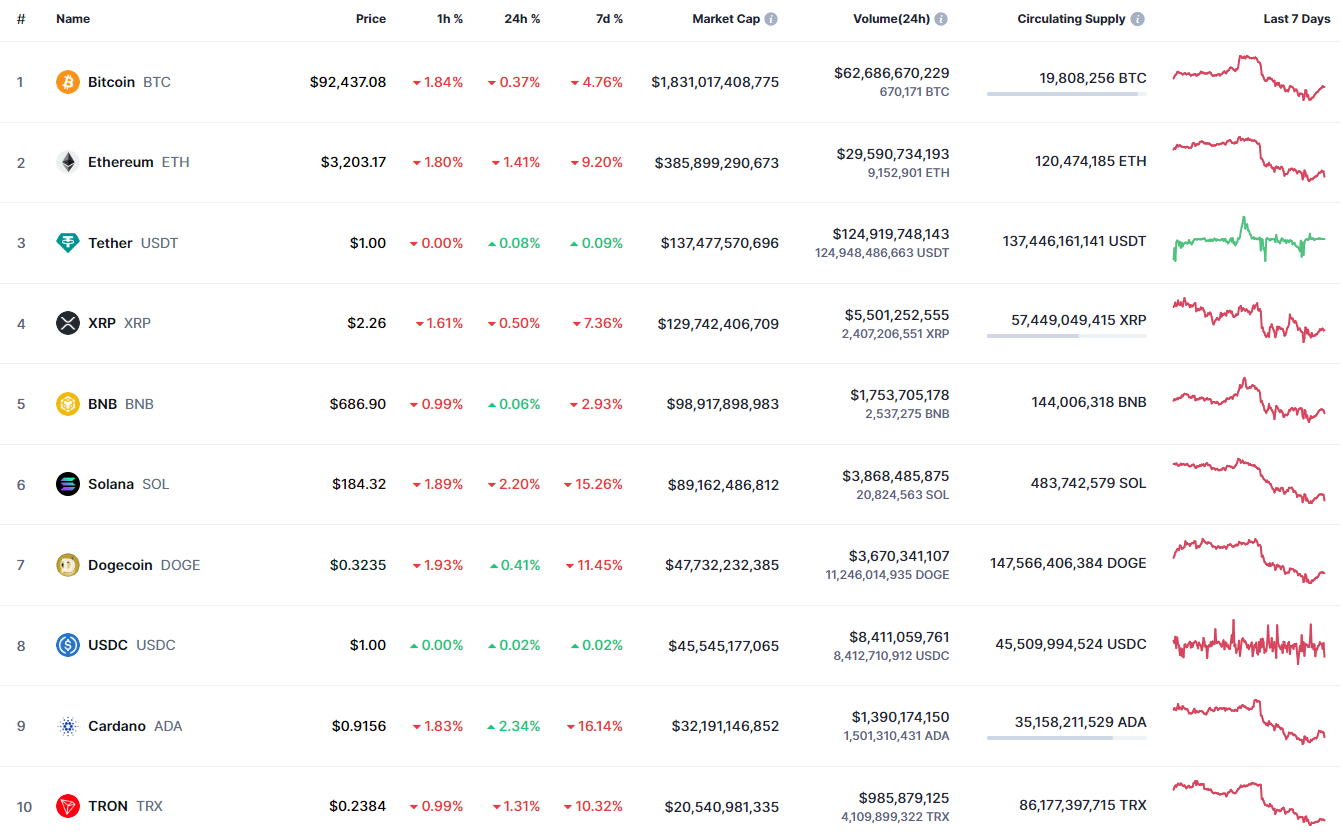
The bears\' pressure continues as most of the coins remain in the red zone, according to CoinMarketCap.

BTC/USD
The rate of Bitcoin (BTC) has declined by 0.37% over the last day.

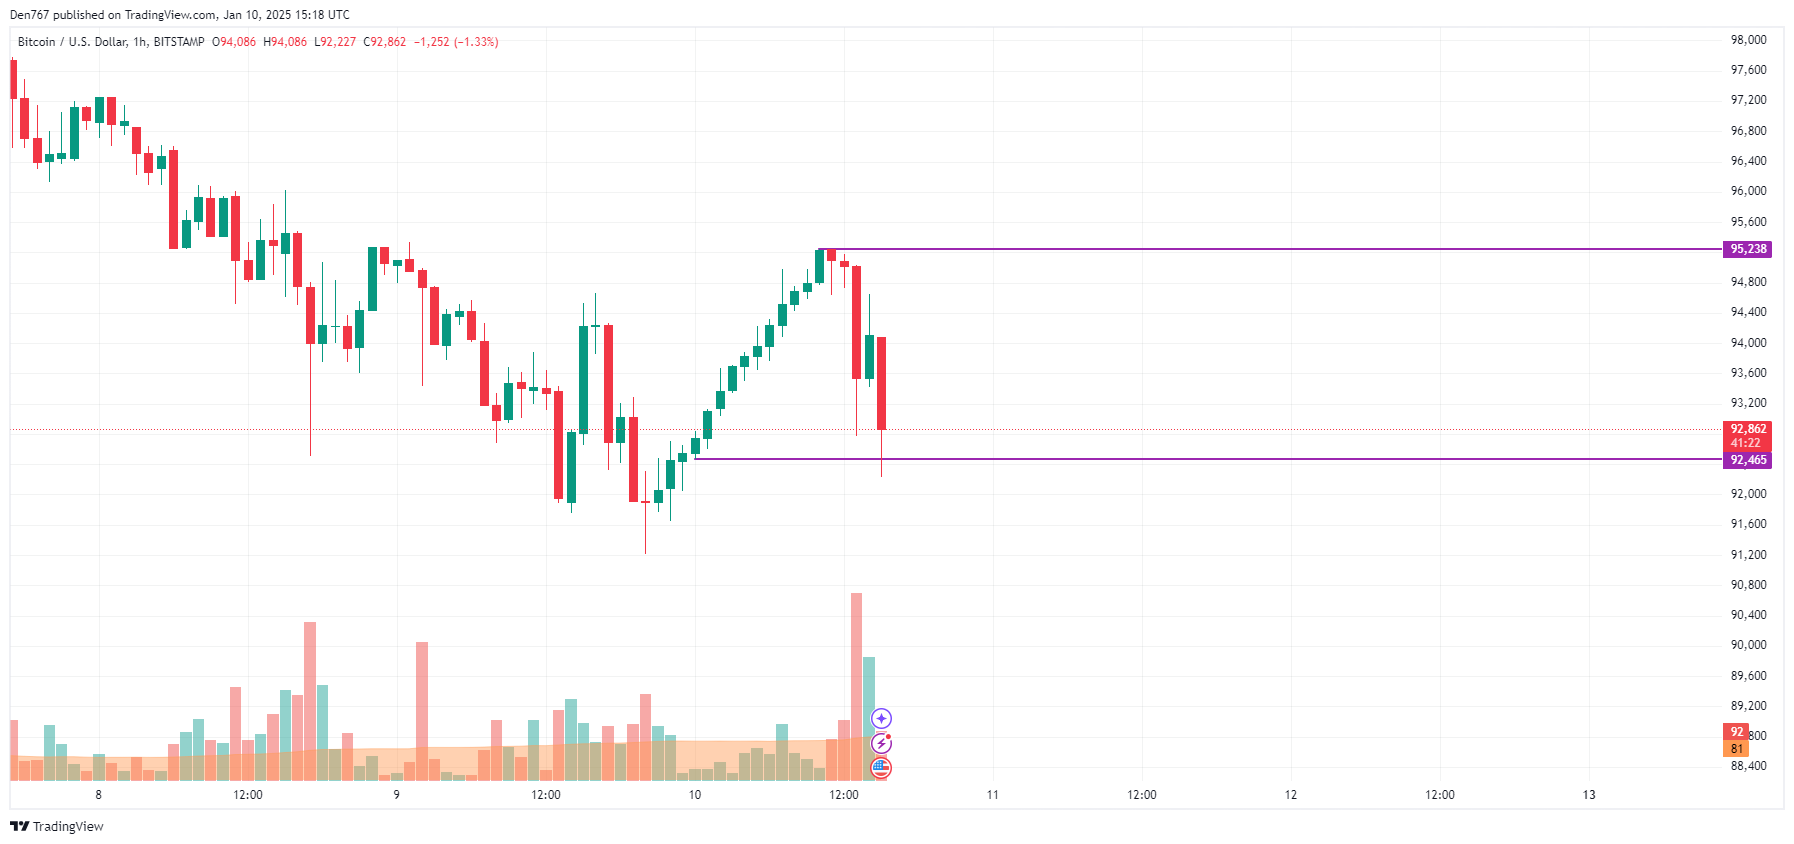
On the hourly chart, the price of BTC is near the local support of $92,465. If the daily bar closes around that mark, the correction is likely to continue to the $91,000 zone.

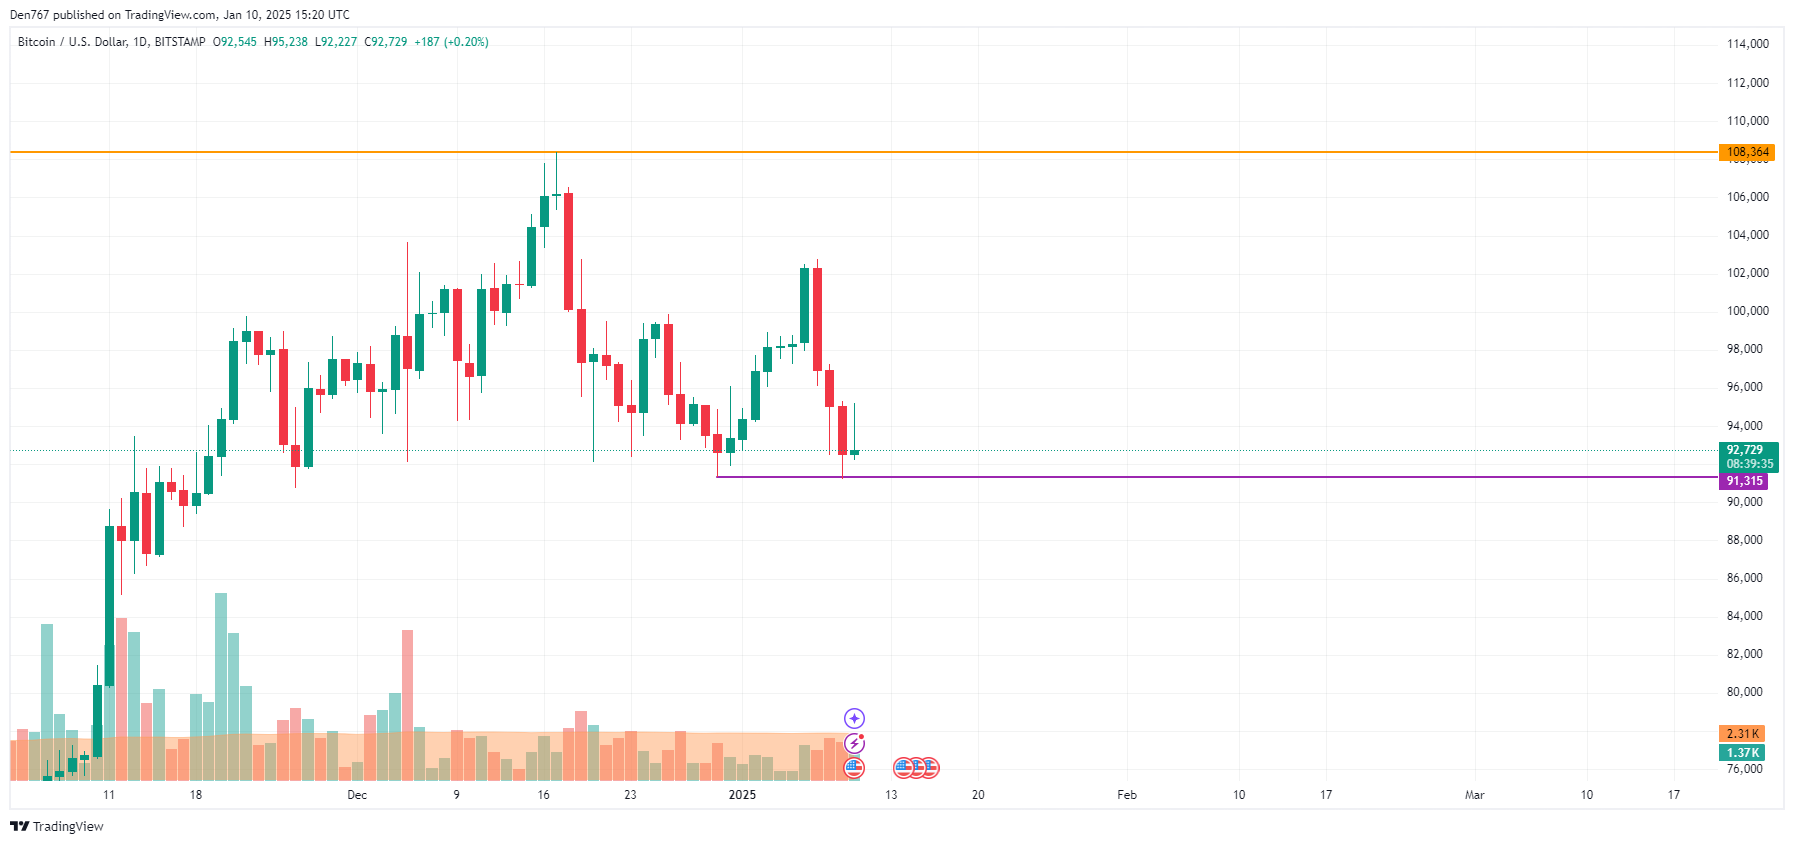
On the bigger time frame, the candle is about to close with a long wick. If bulls cannot seize the initiative until the end of the day, traders may witness a support breakout, followed by a drop to the $88,000-$90,000 range.

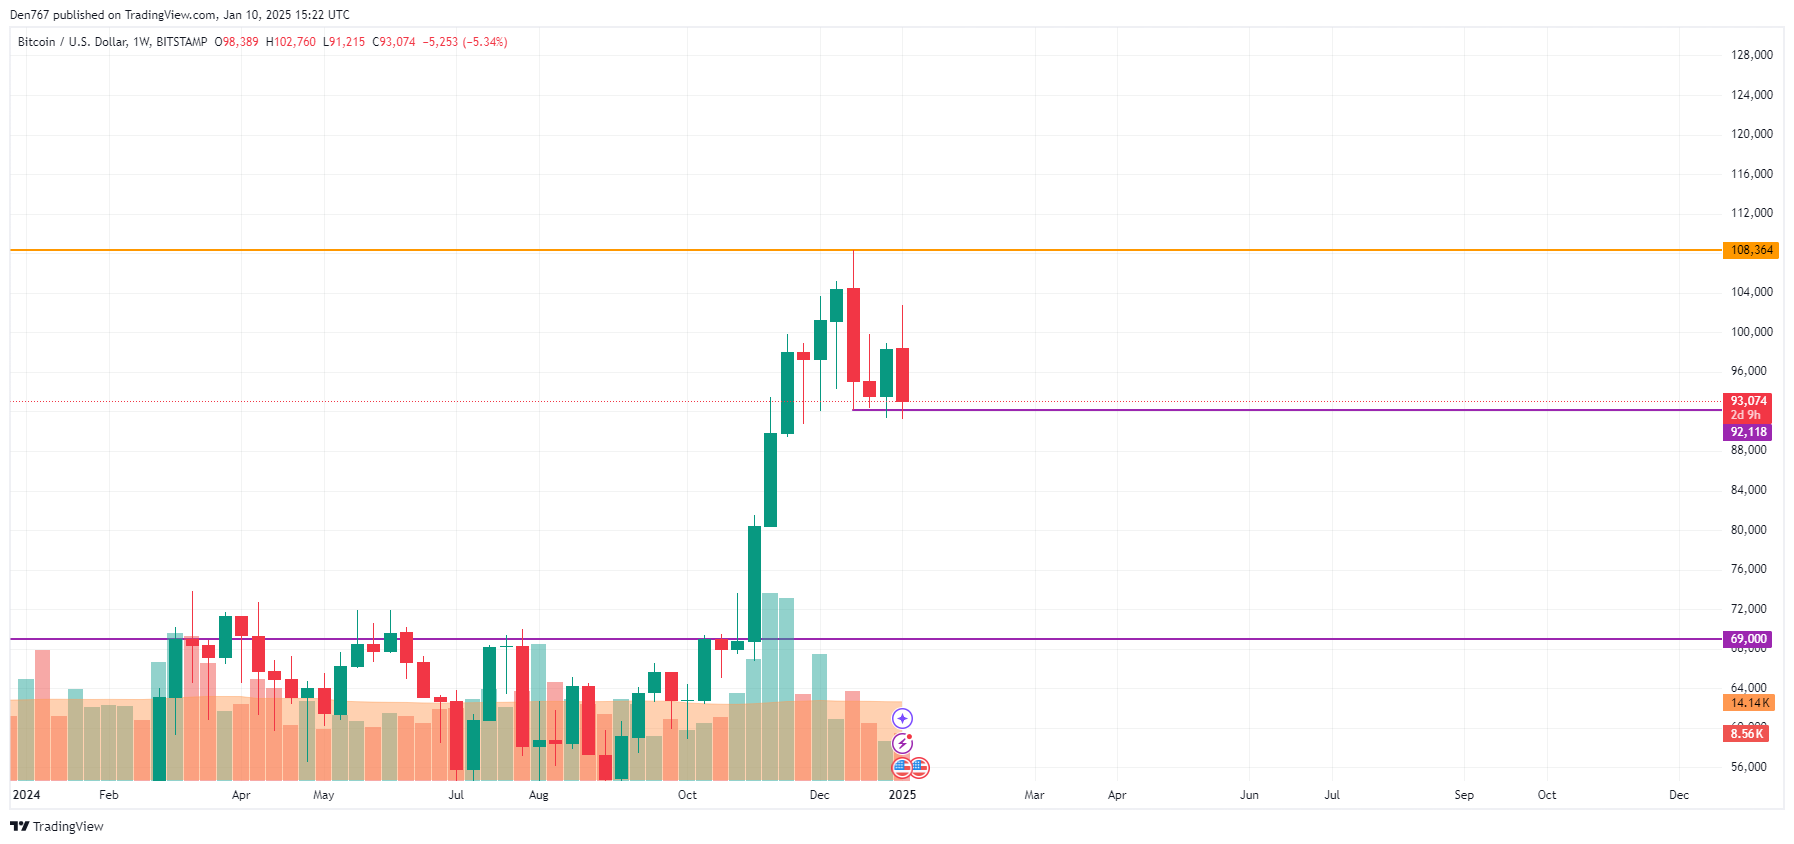
From the midterm point of view, sellers are more powerful than buyers.
If the breakout of the $92,118 level happens, the energy might be enough for a test of the $80,000-$85,000 zone.
Bitcoin is trading at $93,274 at press time.
