
As Bitcoin returns to $95K amid a bearish hiccup, will BTC bulls regain control to reinstate an uptrend?
After a quick pullback of 2.74% in Bitcoin prices over the past 24 hours, BTC has returned to trading at $95,500. Currently taking support at the psychological level of $95,000, this sudden pullback has resulted in market liquidations exceeding $200 million.
With Bitcoin back at the $95,000 crossroads, concerns of a major crash are resurfacing on the charts. Will the BTC price fail to hold its bullish momentum, or is this the ideal time to buy the dip?
Bitcoin Price Analysis Reveals Retest at Hand
On the daily price chart, Bitcoin shows a failure to reach the 50% Fibonacci level at $98,949, resulting in a quick reversal from the upper Bollinger Band near $98,200, forming an evening star pattern.
Since the quick pullback reached the 38.20% level near $97,000, BTC has retested the $95,000 level. Taking support slightly above the 23.60% Fibonacci level, Bitcoin is now consolidating near the lower Bollinger Band.
The quick downfall comes as a potential retest of the recently broken resistance trendline. However, the intensity warns of an extremely slippery slope for Bitcoin bulls.
A close below the 23.60% Fibonacci level could increase the likelihood of BTC price falling to the $90,000 range. On the other hand, the chances of a recovery are indicated by the SMI Ergodic Indicator.
With a bullish divergence in the SMI lines, the indicator also hints at a potential bullish crossover. Furthermore, the SMI lines are fluctuating near the zero line after a significant dip into negative territory.
This reflects a notable recovery in bullish strength and signals a potential bounce back.
ETF Outflows and Market Sentiment
As Bitcoin plunges back to a critical support level, U.S. Bitcoin spot ETFs recorded a daily net outflow. On February 11, Bitcoin spot ETFs bled $56.76 million, with five ETFs offloading in the market.
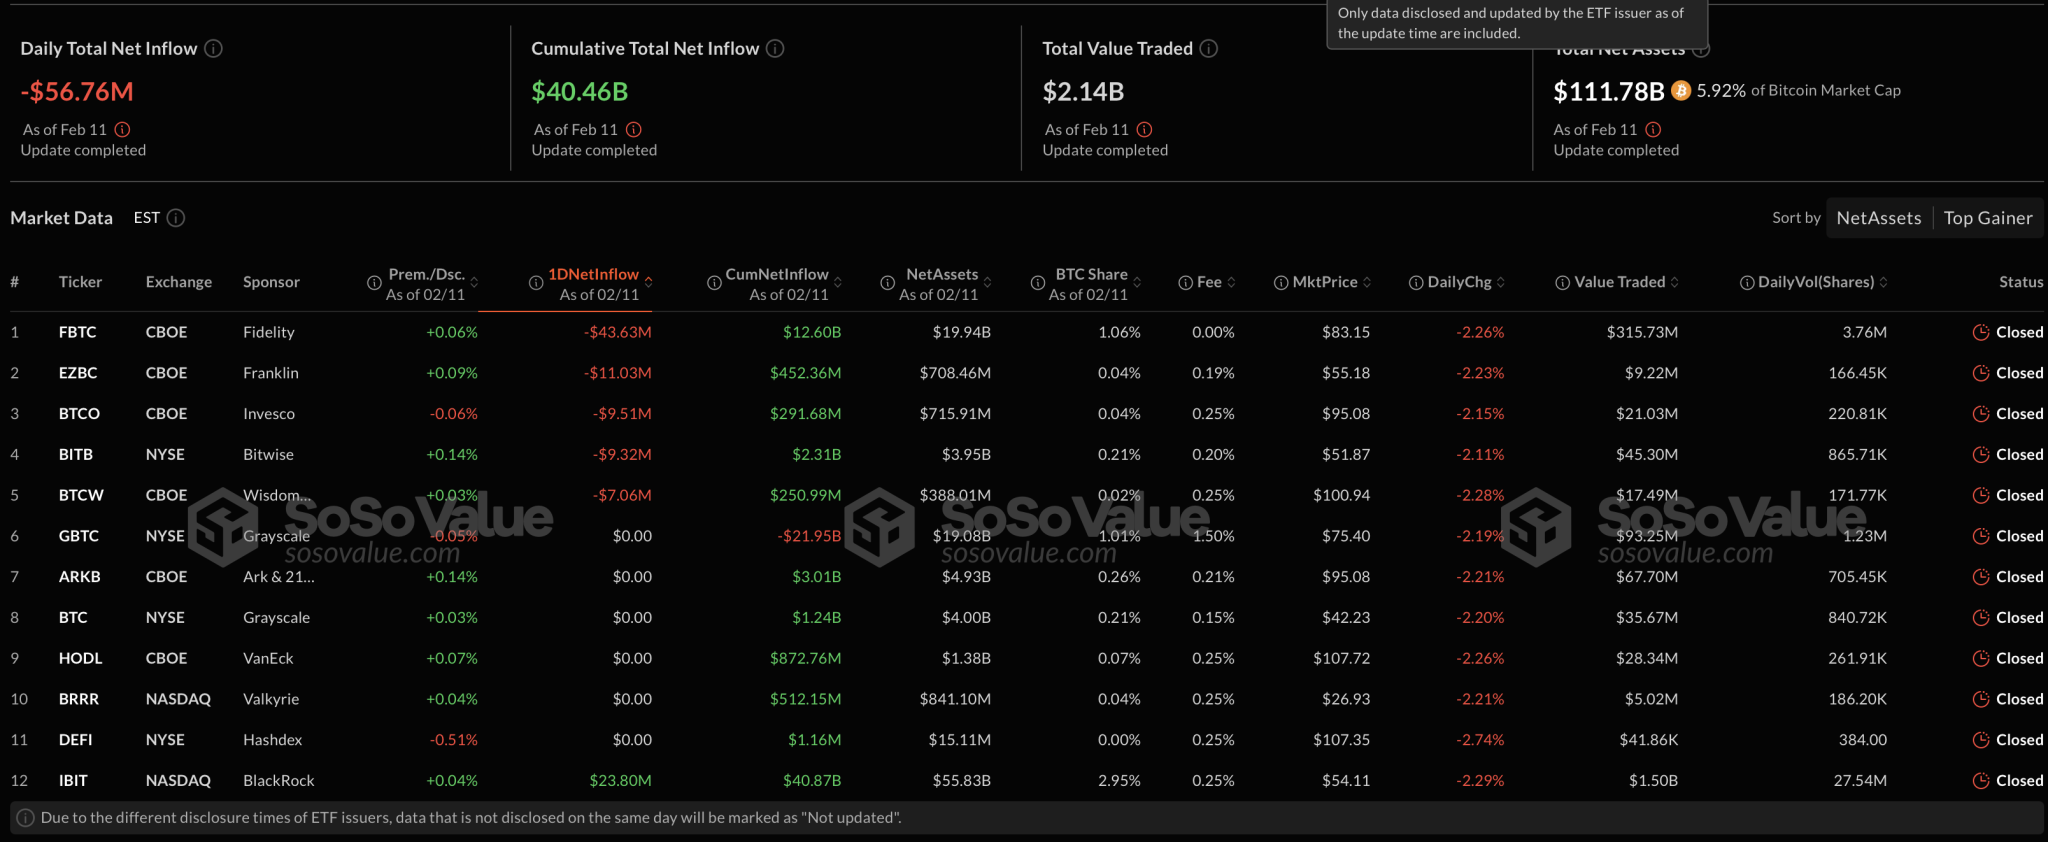
The only purchaser was BlackRock, with a net daily inflow of $23.80 million. This brings BlackRock’s cumulative net inflow since inception to $40.87 billion, with net assets totaling $55.83 billion.
The sellers included WisdomTree, Bitwise, Invesco, Franklin, and Fidelity. Fidelity was the biggest seller of the day, with an outflow of $43.60 million, while Franklin sold off $11.03 million worth of Bitcoin.
The remaining three outflowing ETFs dumped less than $10 million each. Meanwhile, the other six Bitcoin ETFs in the U.S. market recorded net-zero outflows.
Derivatives Market and Bullish Speculation
Following the recent pullback, short-term consolidation has increased bullish speculation in Bitcoin derivatives. The BTC long/short ratio chart reveals a significant spike in bullish positions.
The ratio has increased from 0.9135 to 1.1973, indicating that 54.49% of positions are long. Meanwhile, short positions have dropped to 45.51%.
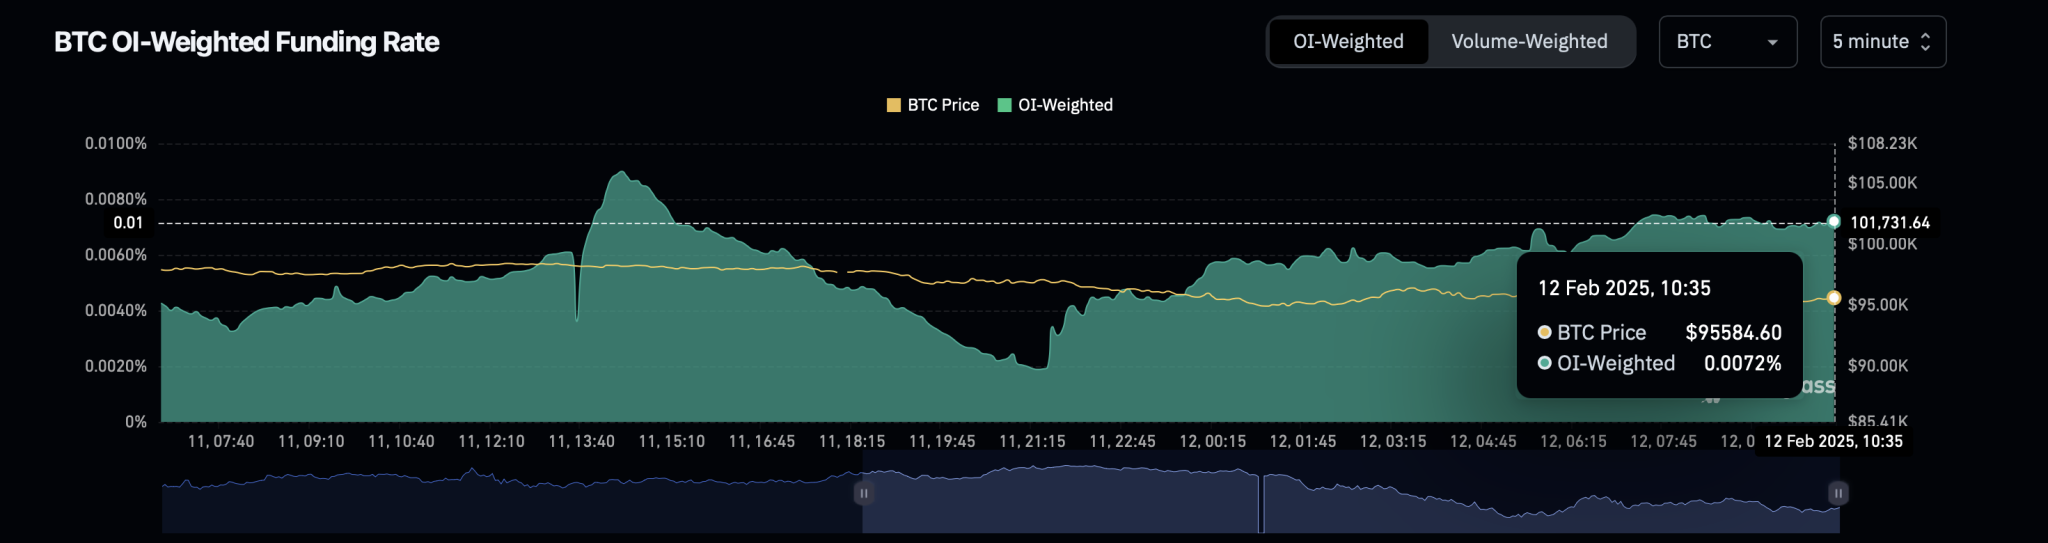
Furthermore, despite the recent drop in BTC prices, the Bitcoin OI-weighted funding rate remains significantly positive. The funding rate currently stands at 0.0072%, reflecting Bitcoin traders’ optimism in holding long positions by paying the extra premium.
BTC Price Targets: $99K or $90K Next?
Given the bullish outlook from Bitcoin traders and the technical signals, buyers are likely to regain control, potentially pushing Bitcoin back toward the 50% Fibonacci level near the $99,000 mark.
On the flip side, if Bitcoin closes below $94,633, the possibility of a further drop remains significant. In this bearish scenario, Bitcoin’s price is likely to revisit the $90,000 level.